How can I take a thread dump and heap dump automatically when my CPU utilization is above 80%?

Thread dumps are vital artifacts to diagnose CPU spikes, deadlocks, memory problems, unresponsive applications, poor response times, and other system problems. There are great online thread dump analysis tools such as http://fastthread.io/ that can analyze and spot problems. But to those tools you need provide proper thread dumps as input. Thus in this article, I have documented 7 different options to capture thread dumps.

1. jstack

‘jstack’ is an effective command line tool to capture thread dumps. The jstack tool is shipped in JDK_HOME\bin folder. Here is the command that you need to issue to capture thread dump:
jstack -l  <pid> > <file-path>
Where:
pid: is the Process Id of the application, whose thread dump should be captured
file-path: is the file path where thread dump will be written in to.
Example:
jstack -l 37320 > /opt/tmp/threadDump.txt
As per the example thread dump of the process would be generated in /opt/tmp/threadDump.txt file.
Jstack tool is included in JDK since Java 5. If you are running in older version of java, consider using other options

2. Kill -3

In major enterprises for security reasons only JREs are installed in production machines. Since jstack and other tools are only part of JDK, you wouldn’t be able to use jstack. In such circumstances, ‘kill -3’ option can be used.
kill -3 <pid>
Where:
pid: is the Process Id of the application, whose thread dump should be captured
Example:
Kill -3 37320
When ‘kill -3’ option is used thread dump is sent to standard error stream. If you are running your application in tomcat, thread dump will be sent in to <TOMCAT_HOME>/logs/catalina.out file.
Note: To my knowledge this option is supported in most flavors of *nix operating systems (Unix, Linux, HP-UX operating systems). Not sure about other Operating systems.

3. JVisualVM

Java VisualVM is a graphical user interface tool that provides detailed information about the applications while they are running on a specified Java Virtual Machine (JVM). It’s located in JDK_HOME\bin\jvisualvm.exe. It’s part of Sun’s JDK distribution since JDK 6 update 7.s
Launch the jvisualvm. On the left panel, you will notice all the java applications that are running on your machine. You need to select your application from the list (see the red color highlight in the below diagram). This tool also has the capability to capture thread dumps from the java processes that are running in remote host as well.
Fig: Java Visual VMFig: Java Visual VM
Now go to the “Threads” tab. Click on the “Thread Dump” button as shown in the below image. Now Thread dumps would be generated.
Image title
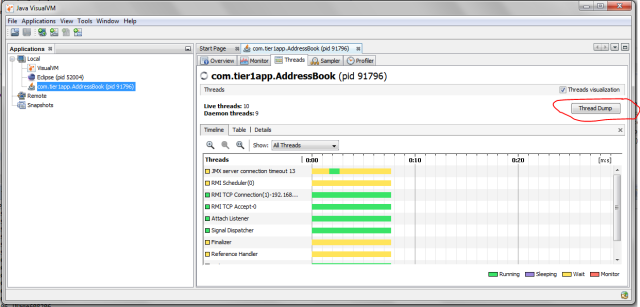
Fig: Highlighting "Thread Dump" button in the “Threads” tab

4. JMC

Java Mission Control (JMC) is a tool that collects and analyze data from Java applications running locally or deployed in production environments. This tool has been packaged into JDK since Oracle JDK 7 Update 40. This tool also provides an option to take thread dumps from the JVM. JMC tool is present in JDK_HOME\bin\jmc.exe
Once you launch the tool, you will see all the Java processes that are running on your local host. Note: JMC also has the ability to connect with java processes running on a remote host. Now on the left panel click on the “Flight Recorder” option that is listed below the Java process for which you want to take thread dumps. Now you will see the “Start Flight Recording” wizard, as shown in the below figure.
Image title
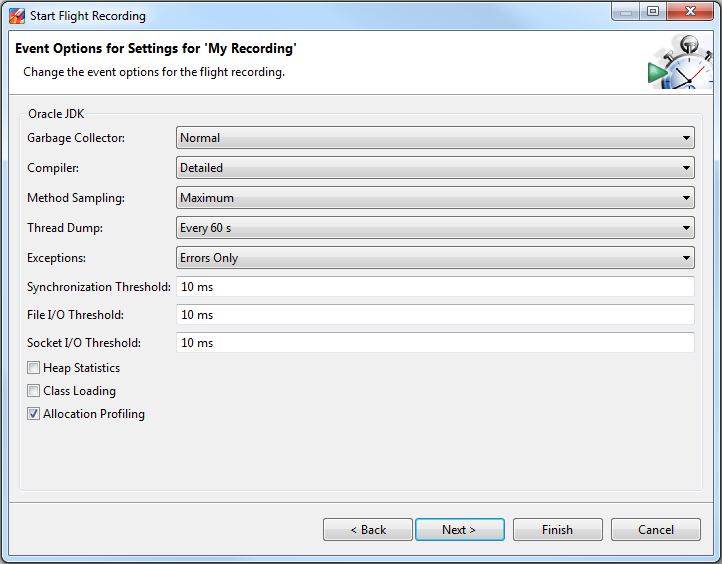
Fig: Flight Recorder wizard showing ‘Thread Dump’ capture option.
Here in the “Thread Dump” field, you can select the interval in which you want to capture thread dump. As per the above example, every 60 seconds thread dump will be captured. After the selection is complete start the Flight recorder. Once recording is complete, you will see the thread dumps in the “Threads” panel, as shown in the figure below.
Image title
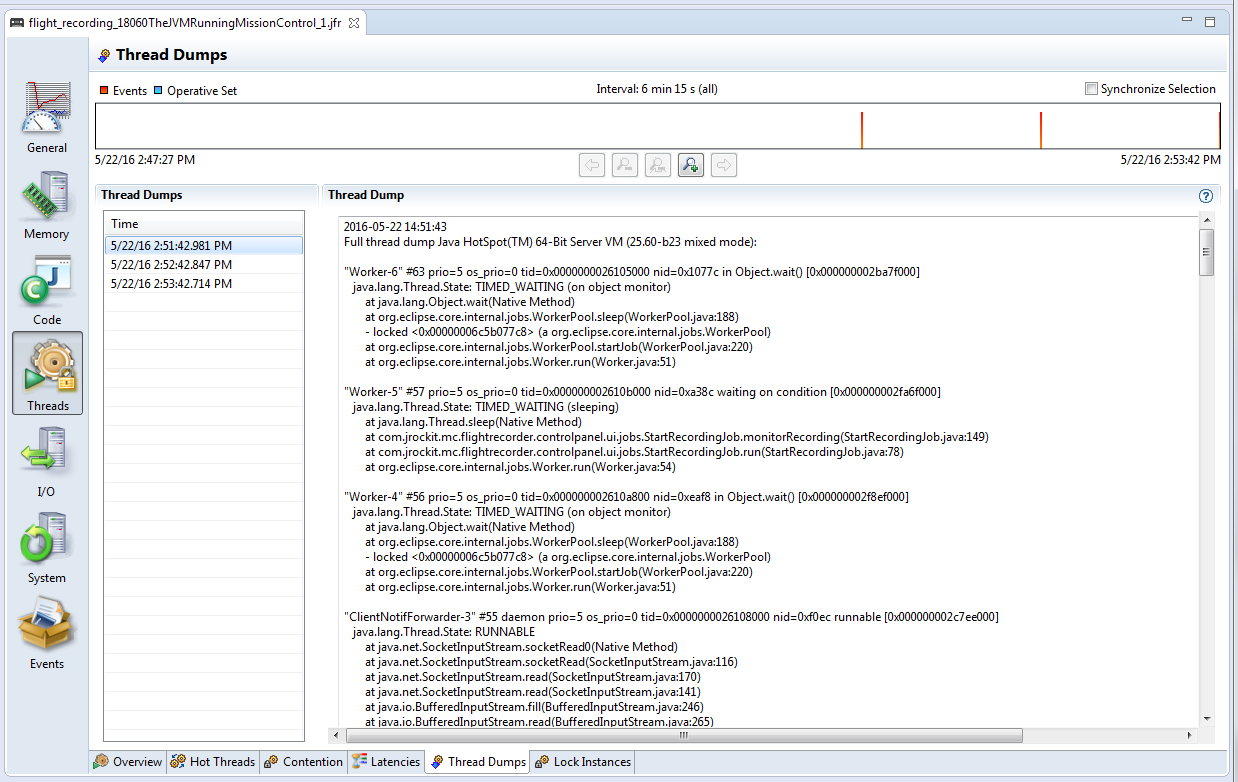
Fig: Showing captured ‘Thread Dump’ in JMC.

5. Windows (Ctrl + Break)

This option will work only in Windows Operating system.
  • Select command line console window in which you have launched application.
  • Now on the console window issue the “Ctrl + Break” command.
This will generate thread dump. The thread dump will be printed on the console window itself.
Note 1: in several laptops (like my Lenovo T series) “Break” key is removedJ. In such circumstances you have to google to find the equivalent keys for the “Break”. In my case it turned out that “Function key + B” is the equivalent of “Break” key. Thus I had to use “Ctrl + Fn + B” to generate thread dumps.
Note 2: But one disadvantage with this approach is thread dump will be printed on the windows console itself. Without getting the thread dump in a file format, it’s hard to use the thread dump analysis tools such as http://fasthread.io. Thus when you launch the application from the command line, redirect the output a text file i.e. Example if you are launching the application “SampleThreadProgram”, you would issue the command:
java -classpath . SampleThreadProgram
Instead launch the SampleThreadProgram like this
java -classpath . SampleThreadProgram > C:\workspace\threadDump.txt 2>&1
Thus when you issue “Ctrl + Break” thread dump will be sent to C:\workspace\threadDump.txt file.

6. ThreadMXBean

Since JDK 1.5 ThreadMXBean has been introduced. This is the management interface for the thread system in the Java Virtual Machine. Using this interface also you can generate thread dumps. You only have to write few lines of code to generate thread dumps programmatically. Below is a skeleton implementation on ThreadMXBean implementation, which generates Thread dump from the application.
    public void  dumpThreadDump() {
        ThreadMXBean threadMxBean = ManagementFactory.getThreadMXBean();
        for (ThreadInfo ti : threadMxBean.dumpAllThreads(true, true)) {
            System.out.print(ti.toString());
        }
    }

7. APM Tool – App Dynamics

Few Application Performance Monitoring tools provide options to generate thread dumps. If you are monitoring your application through App Dynamics (APM tool), below are the instructions to capture thread dump:
1. Create an action, selecting Diagnostics->Take a thread dump in the Create Action window.
2. Enter a name for the action, the number of samples to take, and the interval between the thread dumps in milliseconds.
3. If you want to require approval before the thread dump action can be started, check the Require approval before this Action checkbox and enter the email address of the individual or group that is authorized to approve the action. See Actions Requiring Approval for more information.
4. Click OK.
Image title
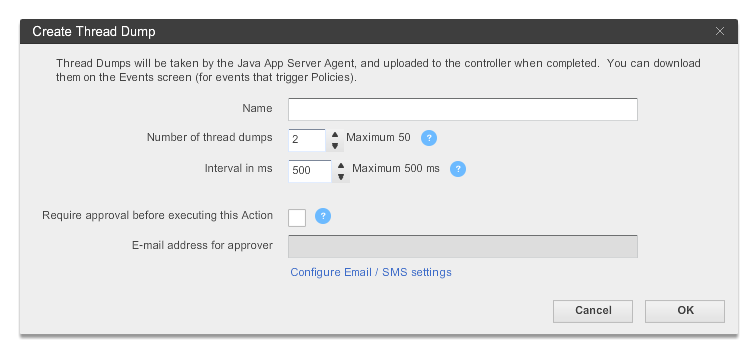
Fig: App dynamics thread dump capturing wizard

8. JCMD

The jcmd tool was introduced with Oracle’s Java 7. It’s useful in troubleshooting issues with JVM applications. It has various capabilities such as identifying java process Ids, acquiring heap dumps, acquiring thread dumps, acquiring garbage collection statistics, ….
Using the below JCMD command you can generate thread dump:
jcmd <pid> Thread.print > <file-path>
where
pid: is the Process Id of the application, whose thread dump should be captured
file-path: is the file path where thread dump will be written in to.
Example:
jcmd 37320 Thread.print > /opt/tmp/threadDump.txt
As per the example thread dump of the process would be generated in /opt/tmp/threadDump.txt file.

Conclusion

Even though 7 different options are listed to capture thread dumps, IMHO, 1. 'jstack' and  2. 'kill -3' are the best ones. Because they are:
a. Simple (straightforward, easy to implement)
b. Universal (works in most cases regardless of OS, Java Vendor, JVM version, etc.)

Run Time Settings in Load runner

In general load runner runtime settings plays a crucial role in Vugen scripting and scenario running.This is the heart of the Load runner.The run time settings are
General
  • Run Logic 
  • Pacing 
  • Log 
  • Think Time 
  • Additional attributes 
  • Miscellaneous 
Network
  • Speed simulation
Browser
  • Browser emulation
Internet Protocol
  • Proxy
  • preferences
  • download filters
  • Content check
Data Format Extension
  •  Configuration

General 
Run Logic 


Whenever I am using a Vuser type that allows multiple actions in a single script, I will create a separate action for each business process and put appropriate percentage weightings on each action. It is very unusual to have to do anything more complicated than this. I don’t usually use the “sequential” option or create blocks unless I need to have fractional percentage weightings for a business process.
Percentages must be integer values, so to run a business process 0.1% of the time you could create a block that runs 1% of the time, and put an action in the block that runs 10% of the time.
It’s also rare to set a script in a scenario to run for a specified number of iterations (mostly done by time or set to run indefinitely). Generally “number of iterations” is only used when running the script in VuGen. 

Pacing :


“As soon as the previous iteration ends” is used when running in VuGen or when loading/verifying data. Do not use this for load testing
I have never seen the point of the “After the previous iteration ends” option. Why would you want to run an unknown number of transactions per hour against the system?
Don’t use the “At fixed intervals”. If something causes your users to become “in step”, they will tend to stay that way and continue to all hit the server at the same time.
“At random intervals” is definitely the way to go. Obviously for your users to create a certain number of orders per hour the iteration time must average to 3600/num iterations in an hour. Do not make the lower boundary value any bigger than the maximum time it takes to complete the business process, or you will end up creating less transactions per hour than you intend to. 


you can check how to calculate pacing according to the requirement from this blog also.

Log :

Enable logging:once you verify that your script is functional,disable logging to conserve resources.
Logging creates additional overhead on your load generators, and can create huge log files. 


 log absolutely everything when debugging in VuGen.
When running the script as part of a scenario, I leave extended logging on but change the logging to “Send messages only when an error occurs”. This gives a little more information than turning logging off entirely, and won’t create any additional overhead while everything is running smoothly (and if the system is not running smoothly you are going to need to stop the test and investigate anyway). 


Standard log:sends a subset of functions and messages sent during script execution to a log.The subset depends on the Vuser type.

Think Time:


Just like the pacing setting, I think that it is a good idea to put some randomness in your think times.
I use a random percentage of 50-150% of recorded think times.
Use “Ignore think time” if you are debugging in VuGen or if you are loading/verifying data. 


Additional attributes :


This option is ignored by most people. It is used to create a parameter with a given value without having to edit the script (as runtime settings can be overridden in the Controller).
In the screenshot I have created a parameter of ServerName with the address of the test envioronment. If you were testing in more than one test environment at a time, this would make save some time. 


Miscellaneous :


Continue on error is generally only going to be used if you have written code to do something when you encounter an error. Usually the default behaviour of ending the current iteration and then starting the next one is sufficient). I don’t advise anyone to try to write a script that handles errors in the same way as a real user because it will create a lot of additional work for very little benefit, but doing something simple like writing some useful information to the logs and then calling lr_exit(LR_EXIT_ACTION_AND_CONTINUE , LR_FAIL) can be useful.
“Fail open transactions on lr_error_message” should always be ticked. If you are raising an error, you should fail the transaction step that you are performing.
“Generate snapshot on error” is useful. If it is a web script, any error messages should be added to your content check rules.
Run your virtual user as a thread unless you have code that is not threadsafe or there is some other reason to run your virtual users as a process. The overall memory footprint on your load generators will be higher if you run as a process.
I never use the “Define each action as a transaction” option. If I want a transaction in my script I will add it myself with lr_start_transaction.
I never use “Define each step as a transaction” either. If it is a web script, I can use the transaction breakdown graph to get this information, otherwise I will add the transactions myself. 


Network :


Not all vuser types have this option available.
Most of the time my virtual users will use the maximum bandwidth.
If I want to emulate users with bandwidth constraints, I will do this in a separate scenario.
Google calculator is handy to calculate bitrates if your bitrate is not available from the drop-down list e.g./ “256 Kbps in bps”
All of the following settings only apply to web-based scripts. Each vuser type will have its own runtime setting options. It is important to know what they mean and how they will influence your
test results before running any tests that you plan to report on. 


Browser

Browser Emulation: 


Some people get confused by the User-Agent (browser to be emulated) setting. If 90% of your users use Internet Explorer 6.0 and the rest use Firefox 1.5, you don’t have to change the runtime settings for your users to match this. All it changes is the string that is sent in the “User-Agent” field of your HTTP requests. This is completely pointless unless your application has been written to serve different content to different browsers based on the User-Agent field.

Internet Protocol:


Proxy : 


Generally people won’t be using your web applications through your proxy server, so it shouldn't be part of your test either.
If you start getting errors that are due a proxy server rather than the system under test, it will just confuse the people who have to fix the problem.
A proxy server will also make IP-based load balancing ineffective.
If it’s an intranet application and everyone will be using the application through the company’s proxy, then the proxy server should be explicity declared to be in scope for your load test. You should make sure that you have an identical proxy server for your test environment, or that you have permission to be generating load on a piece of Production infrastructure. 


Preferences :


These settings are default values specified by HP, rather than being inherited from the web browser that is installed on your workstation. Generally you will not need to change them, but be aware that they are here. 

Download Filters: 


Download filters are a quick way of preventing your scripts from downloading content from certain URLs or hosts/domains.
I generally use this feature when the web application in the test environment contains third-party images used for tracking website usage (e.g. images from Webtrends or Red Sheriff etc).
I think it is better to specify which hosts your script is allowed connect to, rather than which hosts your script can’t connect to (because it’s easy to miss one accidentally, or the application may change and refer to a new third-party domain).
Use web_add_auto_filter if you want to specify this in your script rather than your runtime settings.
Data Format Extension:


Configuration :


A LoadRunner feature that has made my life a lot easier has been ContentCheck rules, which are available in the script runtime settings. If you are using a web-based vuser type, you can configure your Load Runner script to search through all returned pages for strings that match known error messages. 

Using web_reg_find functions is fine, but when you get an error LoadRunner reports it as “failed to find text” instead of something more descriptive. 

I will always create rules for any error messages I find during scripting and, if I receive an error while running a scenario, I will add the error message from the snapshot in the scenario results directory (the snapshot on error feature is very useful). 

All this is pretty obvious if you have taken the time to explore LoadRunner’s features or you have attended a Mercury training session, but I recommend taking things a step further. 
Ask your developers for a list of all the error messages that the application can throw. This should be easy for them to provide if the application is well designed and stores all the message in some kind of message repository instead of sprinkling them throughout the source code. 
Include error message for functional errors that you are likely to encounter. Creating a rule for “incorrect username or password” may save someone 20 minutes of investigation when they first run the script after the database has been refreshed. 

If you prefer to have error message you are checking for in the script (where you can add comments to them) instead of the runtime settings, you can use the web_global_verification function instead. The only difference between the two is the error message that LoadRunner will include in its log: 

Action.c(737): Error -26368: “Text=A runtime error occurred” found for web_global_verification (“ARuntimeErrorOccurred”) (count=1), Snapshot Info [MSH 0 21] 

…compared to: 

Action.c(737): Error -26372: ContentCheck Rule “ARuntimeErrorOccurred” in Application “Webshop” triggered. Text “A runtime error occurred” matched (count=1), Snapshot Info [MSH 0 21]

Creating Dynamic itemdata in Web_submit_data in load runner

I was working on a project where there was a scenario of searching for a course by its first name or wild cards. The search returns different number of results for different queries. This request is followed by another web_submit_data where the ITEMDATA depends on number of search results.

There are three dynamic variables here – length of the course variable, results returned and the third one being the ITEMDATA of the request itself.

The solution is to build dynamic data on the fly and create a web_custom_request for the web_submit_data

The following function will build the item data -

const char* BuildItemData(int pageSize,const char*ItemDataStart,const char*ItemDataEnd, int lengthOfCourseVar, const char* ArrayName){

char* ItemData;

int iCount,lengthOfOneItem;

lengthOfOneItem = lengthOfCourseVar+strlen(ItemDataStart)+strlen(ItemDataEnd);

ItemData = (char*)malloc((pageSize*(lengthOfOneItem))*sizeof(char));

ItemData[0]=”;

for(iCount=1;iCount<=(pageSize);iCount++)

{

strcat(ItemData,ItemDataStart);

strcat(ItemData,lr_paramarr_idx(ArrayName,iCount));

strcat(ItemData,ItemDataEnd);

}

return ItemData;

}

I changed the web_submit_data to web_custom_request and used the string output as a parameter like this:

lr_save_string( BuildItemData(lr_paramarr_len(“cor_Arr_ClassIDs”),”offId[]=class”,”&”,strlen(lr_paramarr_idx(“cor_Arr_ClassIDs”,1)),”cor_Arr_ClassIDs”),
“ItemDataOnTheFly” );


web_custom_request(“xxxxxxx.aspx”,

“URL=https://{par_Environment_URL}/xxxxxx/xxxxxx.aspx”,

“Method=POST”,

“TargetFrame=”,

“Resource=0″,

“RecContentType=text/html”,

“Referer=https://{par_Environment_URL}/xxx/xxx/xxx/xxxx/xx/xxxxxx?xxxxxx={par_Location}”,

“Snapshot=t12.inf”,

“Mode=HTML”,

“EncType=application/x-www-form-urlencoded; charset=utf-8″,

“Body={ItemDataOnTheFly}&lrnid=xxxxx/{par_UserID}”,

LAST);

What is Security Testing?

Security testing is related to the security of data and the functionality of the application. You should be aware of the following concepts while performing security testing:
1. Confidentiality - The application should only provide the data to the relevant party e.g. one customer's transactional data should not be visible to another customer; the irrelevant personal details of the customer should not be visible to the administrator and so on.

2. Integrity - The data stored and displayed by the application should be correct e.g. after a withdrawal, the customer's account should be debited by the correct amount.

3. Authentication - It should be possible to attribute the data transmitted in the application to either the application or the customer. In other words, no one other than the customer or the bank should be able to create or modify any data.

4. Authorization - The application or a user should only be able to perform the tasks which they are respectively authorized to perform e.g. a customer should not be able to withdraw more than the balance in their account without having an overdraft facility, the application should not be able to levy charges on a customer account without prior customer approval.
5. Availability - The data and functionality should be available to the users throughout the working period e.g. if the bank's operating times are from 8 a.m. to 8 p.m. on all working days, it should be possible for a customer to access their account and make the necessary transactions on their account.

6. Non-repudiation - At a later date, it should not be possible for a party to deny that a particular transaction or data change took place e.g. if a customer withdraws an amount from their account, this should trigger the relevant actions (posting to their transaction records, debiting their account and sending them a notification etc.).

In your question, you mentioned that you wish to avoid any data breach by hackers. You should understand that hackers are not the only people from whom the application functionality and data need to be protected. There are other people that you need to consider as well:

1. Disgruntled customers
2. Unhappy or malicious employees of the bank
3. Unprofessional service providers e.g. an unprofessional hosting company that may have access to the application and the data
4. Unprofessional auditors

Further, since financial data is so important, banking applications in certain countries have to be compliant to the relevant financial standards. Research the relevant standards that your application needs to follow.
Creating a secure application involves a lot of work in designing a secure application and designing a secure data store. Even after deployment, the application should be closely monitored to ensure that the data is being accessed by only the authorized people. If any security breach is reported, it should be analyzed carefully and the loopholes plugged.
Now, let us discuss the actual security testing. You should design security tests based on at least the following:

1. Stated security requirements
2. Security-related standards that the application should follow Assuming that it is a web application,
3. Common vulnerabilities found in web applications
4. Different browser versions on different operating systems (here you should note that implementing security only on the client-side may not suffice)
In your initial tests, you may want to use automated testing tools e.g. web vulnerability scanners, password crackers, web proxy tools etc. Based on your learning, you may want to execute the more complex security tests by hand. Keep yourself updated about the latest hacks and test them on your application before every release.

As you might now appreciate, security testing is a vast area of knowledge and practice. In order to do justice to security testing, it is better to have a dedicated team for security testing

"Object reference not set to an instance of an object" analysis error in load runner

This error comes when the following files in (Analysis Install dir)\bin\dat\ are corrupted:

loader2.mdb, loader.mdf, loader.ldf
Solution:

You need to restore these files; take these files from another machine where you have installed the Analysis. Or Re-install the Analysis on your machine after a clean uninstall