Load Runner Introduction and Archietecture

LoadRunner is an industry-leading performance and load testing product by Hewlett-Packard (since it acquired Mercury Interactive in November 2006) for examining system behavior and performance, while generating actual load.

LoadRunner can emulate hundreds or thousands of concurrent users to put the application through the rigors of real-life user loads, while collecting information from key infrastructure components (Web servers, database servers etc). The results can then be analysed in detail, to explore the reasons for particular behaviour.

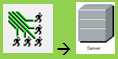
Consider the client-side application for an automated teller machine (ATM). Although each client is connected to a server, in total there may be hundreds of ATMs open to the public. There may be some peak times — such as 10 a.m. Monday, the start of the work week — during which the load is much higher than normal. In order to test such situations, it is not practical to have a testbed of hundreds of ATMs. So, given an ATM simulator and a computer system with LoadRunner, one can simulate a large number of users accessing the server simultaneously. Once activities have been defined, they are repeatable. After debugging a problem in the application, managers can check whether the problem persists by reproducing the same situation, with the same type of user interaction.

HP LoadRunner is an automated performance and test automation product from Hewlett-Packard for examining system behaviour and performance, while generating actual load. HP acquired LoadRunner as part of its acquisition of Mercury Interactive in November 2006.HP LoadRunner can simulate thousands of concurrent users to put the application through the rigors of real-life user loads, while collecting information from key infrastructure components (Web servers, database servers etc.)The results can then be analyzed in detail, to explore the reasons for particular behavior.

LoadRunner supports various application protocols; Flex AMF, Citrix ICA, Remote Desktop Protocol (RDP), ERP/CRM (e.g. SAP, Oracle eBusiness, Siebel and PeopleSoft), Databases, Mail Clients, Web Services, AJAX TruClient (with V.11.0).


LOADRUNNER COMPONENTS 


Loadrunner has mainly three components. 


  • VuGen (Virtual user generator) 
  • Controller (License based component) 
  • Analysis 

apart from these components there are other components like LoadRunner Agent process.

Vugen: 
The purpose of Vugen is to create scripts for single user and do the required enhancements to the script in a such a way that it can be run for multiple users.

Controller:
The purpose of Controller is to Run the load test and monitor the servers during load test execution. In loadrunner language is to create scenarios and the run the loadrunner controller scenario. Generally Controller installed in a client environment machine which will be configured with loadrunner license for defined number of users. Performance engineers to connect to this machine to run the load test. If the client has multiple projects and multiple performance engineer resources, client may setup mutiple controller with multiple licenses.
Analysis:
Analysis will be used to Analyze the results and creare graphs and reports to present the performance test report to stake holders.


File Extensions:

VuGen : .USR is the file extension.
Controller : .lrs is the file extension. - -> .lrr
Analysis : .lra is the file extension

Loadrunner environment:Number of machines required in loadrunner test environment. In general you can use one machine by installing all the components one box. 
1 Machine: Controller, Vugen, Anaylysis and Loadrunner agent process. The disadvantage is we may not able to run bigger load test.
Multiple Machine:
Controller1 - 1 Machine - 1000 user license
Load generators - 3 Machines
Controller2 - 1 Machine - 3000 user license
Load generators - 3 Machines
Controller4 - 1 Machine - 2000 user license
Load generators - 3 Machines 
Architecture of LoadRunner:

SAP Performance Testing(Including volumes details)

The entry criteria for volume and stress in any SAP system are due to following reasons. • Increasing the number of users or adding new users • A major software upgrade like database or operating system migration • A major hardware upgrade like implementing BIA infrastructure for BW • Implementing a new module or new functionality like accessing through SAP Portal instead of SAP GUI The common concern which arises in minds of project team before any SAP application go live can be classified as follows. • How does the database react with existing or desired concurrent SAP users? • Will the implemented SAP application meet the end user performance requirements with respect to response time and throughput? • Is this SAP implemented solution scalable? • Will there be any dumps related to RFC connections and local printing hanging issues during production operation? • Can BIA infrastructure improve the performance of BIW queries? • Can specified number of CRM users create desired volume of tickets per hour? • Is this implemented solution capable of handling estimated production level transaction volumes within the available time frame? • Was the hardware sizing done accurately? • Are Application Servers and Database Servers configured accurately to withstand desired number of processes or requests? • Which component can fail for what time? • Which component of the system limits the number of concurrent users? In every volume test the engagement model begins in the following manner (refer Figure 1). • Request from Project Team: The request can be made in various ways like Service Request (SR), by email or phone call and sometimes project team member walking in with request for testing. • Initiate Kick off meeting: The testing team should initiate kickoff meeting to discuss and understand requirements. During this meeting the scope and objectives of testing should be defined. • Explain the strategy of testing to project team as per the requirement. • Create Service Request with a unique id. • Create the test plan. • Assign resources as per availability in pool and required skill set. Request from Project Team in the form of SR /email / Phone Call / Walk in Is request converted into SR? Testing team initiate Kick Off meeting to understand testing requirements. Scope and Objectives of testing defined. Strategy explained to Project team as per the requirements. Yes No Create SR Test Manager does the testing effort estimation and prepares the high level test plan. Sends to project team against the SR. No Resources allotted as per capacity plan. If the resources are not available in the testing pool then a request for the same is raised. Resource availability TAT 3-4 weeks. STOP YES START Project team and Test Mgr discuss the plan and agree Figure 1: Volume Testing Engagement Model/Framework 2. Effort Estimation To estimate an effort for volume testing is a key task. The effort can be measured based on 3 phases. Phase I: Script Design START Test Mgr/Lead as per the test plan doc identifies the business critical transactions and sends it across to scripting team. Scripting team identifies the protocol and complexity of the script. Test Mgr/Lead sends the delivery date of scripts to project team and execution team as per the input from scripting team. STOP Figure 2: Script Design According to Figure 2 the script complexity is measured by the scripting team. Effort involved is estimated based on this scripting. As a best practice, the scripting effort is designed using a formula keeping in mind the complexity level. Considering a medium complex script a script analyst can cover 1 script in 2 days. Hence the formula is # of Scripts * 2 = # of Man Days Note: This formula also considers script analyst skill in LoadRunner scripting. Phase II: Test Environment Design Test Mgr/ Lead based on test plan doc sends the test environment details to execution team and project Execution team prepares the test environment with help from IS Provider. The Injectors and SAP GUI client installed Test Mgr/ Lead sends confirmation mail to project team and execution team. START STOP Figure 3: Test Environment Design venture between execution team and IS Provider. Based on • SAP test environment: It includes identifying and creating a landscape similar to production • lves few • ner Infrastructure: The number of injectors to simulate or generate the load is • KEY_LOCAL_MACHINE\SOFTWARE\SAP\SAPGUI Front\SAP Frontend • Ena he scripting option can be enabled at server level by executing transaction “rz11”. Check for parameter “sapgui/user_scripting” and set it to ‘True’. Test environment setup is joint requirements captured in test plan document the environment is prepared. This involves setting up: environment consisting of Application Servers and Central Instance with Database. SAP test data: Load copy of production data in test environment. Data copying invo steps to be followed in order to be sure that the data copied is of equal size in the test environment. If we copy data to different environment, say production to QA, then it is normal backup from production and then restore in QA. And if we want to copy data to different platform (say Windows to UNIX) or different DB we need to use "r3load". This is a tool from SAP to import and export table during installation. In certain cases the data used should be confidential. As a result scrambled data is prepared using a third party tool called DSM (Data Sync Manager from EPI-USE). This tool is used to scramble and depersonalize data. LoadRun prepared based on number of concurrent users captured in test plan document. As a best practice in case of SAP R/3 50 virtual users can be simulated from a single injector with configuration of 512 MB RAM and 40 GB hard disk. With similar configuration as a best practice in case of SAP BIW 20 virtual user can be simulated from a single injector. To get better and consistent connectivity between LoadRunner controller and injectors, it is advisable to have same version of LoadRunner package and fix pack installed in controller and injector. Enable scripting at client: The scripting option should be enabled in SAP GUI client. If the scripting option is disabled the LoadRunner scripts can be neither created nor executed. In order to enable scripting at client level go to Run Æ regedit. Set the following parameter value to 1. o [H Server\Security] UserScripting = 1 ble scripting at server: T Pha specific execution plan is created considering all the activities involved uring execution. This master execution plan is captured in excel sheet with following worksheets: • consists of various types of execution scenarios to be executed during s arises. eck is found in • se III: Execution Phase Figure 4: Execution Phase During execution phase a d • Project Activities: This work sheet consists of details tasks or activities to be accomplished before and during execution. • Script Plan: This work sheet consists of all the scripts as per defined business critical scenarios. Scenarios: This work sheet the volume testing. These scenarios are captured initially in test plan document. • Injectors: This work sheet consists of all the injector details with IP address or machine name and location where they are installed. This list also consist of spare or backup injector • Systems and Monitoring: This work sheet consists of detailed information of Servers which will be monitored and parameters which will be considered for monitoring. • Stakeholders: This worksheet is replica of contacts info section in test plan document. This information helps to contact right person during execution if any problem • Test Log: This worksheet is updated by the execution team as a best practice to maintain a log of activities done during execution. For example during execution if any bottlen application server then extra application server is added and again tested. This kind of details should be captured in test log which during final reporting helps to prepare a good report. Actions Issues: Any action items to be taken care by stakeholders or issues encountered during any phase of volume testing are registered in this worksheet. Execution Team executes the test. Encounter Bottlenecks Yes Bottleneck details sent to Project team. An further executio ns y Test Manager/Lead sends the consolidated report j Document the necessary parameter changes required. No Make the necessary parameter changes. Yes START No STOP • Lessons Learnt: The captured data from lessons learnt are documented in SAP Volume Testing Best Practices for future reference. 

Pre-requisite for SAP GUI Protocol scripting in Loadrunner

The fundamental requirement of Loadrunner to record and run SAP GUI scripts requires few settings at client and server side. Here are the main settings you need to incorporate:
1. Enable scripting at client side:
  • Install SAP GUI client on Vugen
  • To ensure that scripting is available on the client-end, check that there is a Scripting directory located in the SAP GUI installation directory.  If this directory does not exist, then the SAP Scripting API is not installed and you must reinstall SAP GUI with the SAP Scripting API option.
  • Once you have script SAP GUI complete package installed, configure all the required systems in SAP GUI, You will require the details of servers like server name, system number etc.
  • Ensure you have connectivity between SAP GUI and SAP server, if not then request for necessary ports to be opened.
  • You need to enable Scripting as circled in the red colour in the screen shot below and disable all check boxes as shown in the screen shot shown below. In order to do this, log on to SAP server, select the “Rainbow” Icon and select “Options”. And you must disable the remaining two check boxes
    - Notify When a Script attaches to a Running GUI
    - Notify When a Script Opens a Connection


2. Enable scripting at server side:
  • Logon to SAP with a user with required privileges, User ID need to have proper privilege to enable scripting at server side. Basis should be able to provide you administrative privilege to do the same.
  • Logon to SAP using SAP GUI, run the transaction rz11, and enter parameter name sapgui/user_script.
  • Enable the parameter with the Current value changed to TRUE.  Save it and enable the changes on all the servers and scripting will be enabled the next time you log on.  

SAP GUI LoadRunner Commands

    The SAP Add-in for LoadRunner provides several sapgui specific functions.
    A recording of the SAPGUI front end client connecting and logging into the server captured these functions:
      sapgui_open_connection_ex(
      sapgui_select_active_connection("con[1]");
      sapgui_select_active_session("ses[0]");
      sapgui_select_active_window("wnd[0]");
      sapgui_window_resize(
      sapgui_logon(

    When a SAP transaction/command is specified:
      sapgui_set_ok_code(
      sapgui_send_vkey(F4,

      sapgui_select_menu
      sapgui_press_button("Enter Times (F5)", btn5,
      sapgui_select_tab and sapgui_is_tab_selected
      sapgui_select_active_window("wnd[1]");
      sapgui_window_scroll_to_row("0",

    Actions on a data entry screen:
      sapgui_set_focus(ctxtBSEG1,
      sapgui_set_text("Text", "{Text}", ctxtBSEG1,

      NOTE: Variable-length strings (defined as char*) are automatically created during recording within lr_strings.h for reference in commands.

      sapgui_set_password(
      sapgui_set_checkbox( and sapgui_is_checkbox_selected
      sapgui_select_radio_button( and sapgui_is_radio_button_selected
      sapgui_select_combobox_entry(
      sapgui_table_fill_data("Table", tblSAPLCATSTC_CATSD2, "{data}",

    Verification functions:
      sapgui_get_active_window_title(
      sapgui_get_ok_code( in the Command field text
      sapgui_get_text(
      sapgui_get_status_bar_text(
      sapgui_grid_get_cell_data(
      sapgui_grid_get_rows_count(

Go to Top of this page.
Next topic this page

Set screen Web Services

    IDoc (intermediate document) provide a standard data container structure for SAP to exchange data between processes, such as asynchronous EDI (electronic data interchange) between application programs written for SAP or between an SAP application and an external program.
    IDocs is the vehicle for data transfer in SAP's Application Link Enabling (ALE) layer.
    Different types of IDoc are used for purchase orders or invoices.
    In other words, an IDoc encapsulates data so that it can be exchanged between different systems without conversion from one format to another. Each IDoc generated exists as a self-contained text file that can then be transmitted to a receiver (requesting workstation) without connecting to the central database.
    There are several types of IDoc records: a single Control Record, one or many Data Records, and one or many Status record. Segments and attributes of segments (maximum number, hierarchical sequence, segment status, etc.) are used for interpretating the SDATA field in the data record. Each IDoc consists of several segments and a unique number assigned each iDoc for tracking and future reference. Each segment contain several fields.
    IDoc data is then converted by SAP's EDI subsystem to a universal EDI standard such as UN/EDIFACT (Electronic Data Interchange for Administration, Commerce, and Trade) or ANSI/X12.
    Business Application Programming Interface (BAPI) is used for synchronous communication method sRFC because data usually is returned to the sending system.
    BAPI methods are stored as RFC-capable function modules in the ABAP Workbench Function Builder accessing the SAP Business Object Repository (BOR).

Sap Gui Protocol in loadRunner


Approach to Create SAP GUI script with Load Runner 11.5
Improved VuGen haveRecording 64bit Applications.Improved Correlations.Integrating Virtualized Services .Web Protocol Asynchronous Support. 
Planning:
1 Plan the Features that need to be considered under Load Test.Plan the Protocol that is essential.3) Plan the statistics of responses.4) Plan the statistics that need be parameterized and Looping.5) Take the Bench Marks of the single user request and Responses.6) Plan about dynamic data that need to seized and correlated for the successful running of VUGEN.


7) Plan for Control , the actual Load Test for VUser

1) Goal Oriented Scenario or a Manual scenario.2) Select the Ram Up.3) Execute the Test.4) Analysis the results.
Scripting:
Record the Script.
Divide the script into Action and Name them.
Ex : Login_Admin , Search_10_Users, Update_5_Users , Logout_Admin.
Enhance the script (Parameterization, Inbuilt Function, Logic)
Correlation if needed. (If it is a SAP WEB script).
Run The Script: Mark the Truncation Times , make sure it not Failing .
Define Run logic (hierarchy of Blocks and Actions and number of interactions for both Actions and Blocks).
Approach to Create SAP GUI script
1) Select the protocol as “SAP GUI”.

2) Hit on Record button to select “Windows”
Now provide the 'SAP Login' exe file path in below 'Application to record' field .
and then just place the cursor at Working Directory Test field and click.
Now you can see the “Start Recording” Button gets enabled.

3) Not hit “Start Recording” and log into the sap GUI and do the required truncations or action.
4) While recording divide the actions based on the functionality.
5) Parameterized the below value Carname as shown.

6) Used below functions to generate the sample script
/* -------------------------------------------------------------------------------
Script Title : SAP GUI sample

Script Description : Record and Play

Recorder Version : 2216

Created By : Saka Amar .
------------------------------------------------------------------------------- */
vuser_init()
{
sapgui_open_connection_ex(" /SAP_CODEPAGE=1100 /FULLMENU /H/ides.consolut.eu/H/n4sexternal 01 /3 /UPDOWNLOAD_CP=2",
"LR",
"con[2]");
sapgui_select_active_connection("con[2]");
sapgui_select_active_session("ses[0]");
sapgui_select_active_window("wnd[0]");
sapgui_window_resize("187",
"25",
BEGIN_OPTIONAL,
"AdditionalInfo=sapgui104",
END_OPTIONAL);
/*Before running script, enter password in place of asterisks in logon function*/
lr_think_time(25);
sapgui_logon("DEVELOPER",
"qtbg",
"500",
"EN",
BEGIN_OPTIONAL,
"AdditionalInfo=sapgui1015",
END_OPTIONAL);
lr_think_time(8);
sapgui_set_ok_code("/OSE93",
BEGIN_OPTIONAL,
"AdditionalInfo=sapgui1016",
END_OPTIONAL);
sapgui_press_button("Enter",
btn1,
BEGIN_OPTIONAL,
"AdditionalInfo=sapgui1017",
END_OPTIONAL);
sapgui_select_active_session("ses[1]");
sapgui_select_active_window("wnd[0]");
sapgui_window_resize("187",
"25",
BEGIN_OPTIONAL,
"AdditionalInfo=sapgui204",
END_OPTIONAL);
sapgui_send_vkey(F4,
BEGIN_OPTIONAL,
"AdditionalInfo=sapgui205",
END_OPTIONAL);
sapgui_select_active_window("wnd[1]");
sapgui_window_scroll_to_row("0",
BEGIN_OPTIONAL,
"AdditionalInfo=sapgui209",
END_OPTIONAL);
sapgui_set_focus(lbl1,
BEGIN_OPTIONAL,
"AdditionalInfo=sapgui208",
END_OPTIONAL);
sapgui_send_vkey(F2,
BEGIN_OPTIONAL,
"AdditionalInfo=sapgui2012",
END_OPTIONAL);
sapgui_select_active_window("wnd[0]");
sapgui_press_button(" Display",
btn2,
BEGIN_OPTIONAL,
"AdditionalInfo=sapgui2015",
END_OPTIONAL);
lr_think_time(8);
sapgui_press_button("Test (F8)",
btn3,
BEGIN_OPTIONAL,
"AdditionalInfo=sapgui2018",
END_OPTIONAL);
sapgui_send_vkey(F4,
BEGIN_OPTIONAL,
"AdditionalInfo=sapgui2021",
END_OPTIONAL);
sapgui_select_active_window("wnd[1]");
sapgui_window_scroll_to_row("0",
BEGIN_OPTIONAL,
"AdditionalInfo=sapgui2025",
END_OPTIONAL);
sapgui_set_focus(lbl2,
BEGIN_OPTIONAL,
"AdditionalInfo=sapgui2024",
END_OPTIONAL);
sapgui_send_vkey(F2,
BEGIN_OPTIONAL,
"AdditionalInfo=sapgui2028",
END_OPTIONAL);
sapgui_select_active_window("wnd[0]");
sapgui_press_button(" Display",
btn2,
BEGIN_OPTIONAL,
"AdditionalInfo=sapgui2031",
END_OPTIONAL);
sapgui_status_bar_get_text("paramStatusBarText",
BEGIN_OPTIONAL,
"Recorded status bar text: Fill in all required entry fields",
"AdditionalInfo=sapgui2034",
END_OPTIONAL);
sapgui_send_vkey(F4,
BEGIN_OPTIONAL,
"AdditionalInfo=sapgui2035",
END_OPTIONAL);
sapgui_select_active_window("wnd[1]");
sapgui_window_close(
BEGIN_OPTIONAL,
"AdditionalInfo=sapgui2038",
END_OPTIONAL);
lr_think_time(5);
sapgui_select_active_window("wnd[0]");
sapgui_set_ok_code("/OSE93",
BEGIN_OPTIONAL,
"AdditionalInfo=sapgui2041",
END_OPTIONAL);
sapgui_press_button(" Display",
btn2,
BEGIN_OPTIONAL,
"AdditionalInfo=sapgui2042",
END_OPTIONAL);
sapgui_status_bar_get_text("paramStatusBarText",
BEGIN_OPTIONAL,
"Recorded status bar text: Fill in all required entry fields",
"AdditionalInfo=sapgui2045",
END_OPTIONAL);
sapgui_set_ok_code("/OSE93",
BEGIN_OPTIONAL,
"AdditionalInfo=sapgui2046",
END_OPTIONAL);
sapgui_press_button("Enter",
btn1,
BEGIN_OPTIONAL,
"AdditionalInfo=sapgui2047",
END_OPTIONAL);
sapgui_select_active_session("ses[2]");
sapgui_select_active_window("wnd[0]");
sapgui_window_resize("187",
"25",
BEGIN_OPTIONAL,
"AdditionalInfo=sapgui304",
END_OPTIONAL);
lr_think_time(10);
sapgui_set_text("Transaction Code",
"ZALV_REPORT",
ctxtTSTC1,
BEGIN_OPTIONAL,
"AdditionalInfo=sapgui305",
END_OPTIONAL);
sapgui_press_button(" Display",
btn2,
BEGIN_OPTIONAL,
"AdditionalInfo=sapgui307",
END_OPTIONAL);
lr_think_time(4);
sapgui_press_button("Test (F8)",
btn3,
BEGIN_OPTIONAL,
"AdditionalInfo=sapgui3010",
END_OPTIONAL);
sapgui_grid_select_cell_row("5",
shell1,
"5",
BEGIN_OPTIONAL,
"AdditionalInfo=sapgui3013",
END_OPTIONAL);
sapgui_grid_select_rows("5",
shell1,
"5",
BEGIN_OPTIONAL,
"AdditionalInfo=sapgui3014",
END_OPTIONAL);
sapgui_grid_double_click_current_cell("(5, Airline Code)",
shell1,
BEGIN_OPTIONAL,
"CurrentRow=5",
"CurrentCell=CARRID",
"AdditionalInfo=sapgui3015",
END_OPTIONAL);
sapgui_grid_select_cell_row("10",
shell1,
"10",
BEGIN_OPTIONAL,
"AdditionalInfo=sapgui3018",
END_OPTIONAL);
sapgui_grid_select_rows("10",
shell1,
"10",
BEGIN_OPTIONAL,
"AdditionalInfo=sapgui3019",
END_OPTIONAL);
sapgui_grid_double_click_current_cell("(10, Airline Code)",
shell1,
BEGIN_OPTIONAL,
"CurrentRow=10",
"CurrentCell=CARRID",
"AdditionalInfo=sapgui3020",
END_OPTIONAL);
sapgui_grid_select_cell_row("16",
shell1,
"16",
BEGIN_OPTIONAL,
"AdditionalInfo=sapgui3023",
END_OPTIONAL);
sapgui_grid_select_rows("16",
shell1,
"16",
BEGIN_OPTIONAL,
"AdditionalInfo=sapgui3024",
END_OPTIONAL);
sapgui_grid_double_click_current_cell("(16, Airline Code)",
shell1,
BEGIN_OPTIONAL,
"CurrentRow=16",
"CurrentCell=CARRID",
"AdditionalInfo=sapgui3025",
END_OPTIONAL);
lr_think_time(10);
sapgui_press_button("Sort in Ascending Order (Ctrl+F4)",
btn4,
BEGIN_OPTIONAL,
"AdditionalInfo=sapgui3028",
END_OPTIONAL);
lr_think_time(9);
sapgui_select_active_window("wnd[1]");
sapgui_press_button("Add Sort Criterion (F7)",
btnAPP_WL_SING1,
BEGIN_OPTIONAL,
"AdditionalInfo=sapgui3031",
END_OPTIONAL);
lr_think_time(4);
sapgui_press_button("Transfer (Enter)",
btn1,
BEGIN_OPTIONAL,
"AdditionalInfo=sapgui3034",
END_OPTIONAL);
lr_think_time(6);
sapgui_select_active_window("wnd[0]");
sapgui_press_button("Sort in Ascending Order (Ctrl+F4)",
btn4,
BEGIN_OPTIONAL,
"AdditionalInfo=sapgui3037",
END_OPTIONAL);
sapgui_select_active_window("wnd[1]");
sapgui_grid_select_rows("'Column Set', 0",
shell2,
"0",
BEGIN_OPTIONAL,
"AdditionalInfo=sapgui3040",
END_OPTIONAL);
sapgui_press_button("Add Sort Criterion (F7)",
btnAPP_WL_SING1,
BEGIN_OPTIONAL,
"AdditionalInfo=sapgui3041",
END_OPTIONAL);
sapgui_press_button("Transfer (Enter)",
btn1,
BEGIN_OPTIONAL,
"AdditionalInfo=sapgui3044",
END_OPTIONAL);
lr_think_time(7);
sapgui_select_active_window("wnd[0]");
sapgui_press_button("Sort in Ascending Order (Ctrl+F4)",
btn4,
BEGIN_OPTIONAL,
"AdditionalInfo=sapgui3047",
END_OPTIONAL);
sapgui_select_active_window("wnd[1]");
sapgui_grid_select_cell("'Sort criteria' (1, @3F@)",
shell3,
"1",
"DOWN",
BEGIN_OPTIONAL,
"AdditionalInfo=sapgui3050",
END_OPTIONAL);
sapgui_grid_select_rows("'Sort criteria', 1",
shell3,
"1",
BEGIN_OPTIONAL,
"AdditionalInfo=sapgui3051",
END_OPTIONAL);
sapgui_grid_click_current_cell("'Sort criteria' (1, @3F@)",
shell3,
BEGIN_OPTIONAL,
"CurrentRow=1",
"CurrentCell=DOWN",
"AdditionalInfo=sapgui3052",
END_OPTIONAL);
sapgui_press_button("Transfer (Enter)",
btn1,
BEGIN_OPTIONAL,
"AdditionalInfo=sapgui3055",
END_OPTIONAL);
return 0;
}

Improved VuGen:
The VuGen user interface has been improved and enhanced to provide a more flexible and customizable user experience. An all new IDE makes LoadRunner scripting easier and more productive.
New look and feel – Flexible panes, layouts, and more
Solution Explorer – An easier way to group multiple scripts, access script items, and perform script-related operations.

Snapshots – Multiple views, improved performance, snapshot synchronization, and search functionality.

Improved editor – Context-sensitive support, code completion support, and provides enhanced coloring and formatting.
Debugger – Real C language debugger.
Search and replace – New capabilities include search in log and snapshots.

Step navigator – The new Step Navigator replaces the tree view, providing a single view of the script with easy filtering and search mechanisms.

New panes – Errors, Tasks, and Bookmarks panes display all errors, messages, and tags in simple, easy to locate views.

Join the Community – Community integration provides easy access to conversations and threads in the HP Software Community.
Improved Correlations:
A new response correlation capability has been added so correlation is easier and faster. Correlations can now be found based on server responses during recording, in many cases eliminating the need to replay iteratively to find dynamic values. Coupling this with the new Correlation Studio interface and new APIs for locating parameters based on XPath and Regular Expressions, makes scripting easier and faster
Recording 64bit Applications :
Recording of 64bit applications has been added to the existing support for 64bit operating systems. 64bit applications can usually be recognized when the ‘*32’ suffix is not displayed in the Windows Task Manager for their process. Replay is in 32bit.
Integrating Virtualized Services :
Integrate with HP Service Virtualization, and use simulated services, to facilitate load testing business processes that contain services that are not readily available or too costly. As part of your performance test, you may want to test applications that depend on other services which are a part of your business scenario. Instead of loading actual services, you can use simulated services in your test run. The virtualized services are a simulation of actual services. To facilitate performance testing business processes that contain services that are not available, Performance Center integrates with HP Service Virtualization. Using simulated services in your test is helpful if using actual services involves an additional cost or requires the service of an application that is under development or inaccessible at the time when you run your performance test.

Support for asynchronous behavior has been added. This new capability enables recording of Poll, Long Poll, and Push interactions.
Advanced Web applications contain a lot of asynchronous communication designed to keep information current and up to date. Applications such as chat, messaging, stock tickers, and news updates all use various asynchronous mechanisms such Poll, Long Poll, and Push to maintain data. Support for these mechanisms has been added to Web (HTTP/HTML) Vuser scripts, and web-based functions inside Flex, Silverlight, and Web Services Vuser scripts. These unique communication patterns are recognized automatically and the recorded script is updated accordingly.

Scripting:

Web Protocol Asynchronous Support :

Top 10 Causes of Java EE Enterprise Performance Problems

Performance problems are one of the biggest challenges to expect when designing and implementing Java EE related technologies. Some of these common problems can be faced when implementing either lightweight or large IT environments; which typically include several distributed systems from Web portals & ordering applications to enterprise service bus (ESB), data warehouse and legacy Mainframe storage systems.It is very important for IT architects and Java EE developers to understand their client environments and ensure that the proposed solutions will not only meet their growing business needs but also ensure a long term scalable & reliable production IT environment; and at the lowest cost possible. Performance problems can disrupt your client business which can result in short & long term loss of revenue.This article will consolidate and share the top 10 causes of Java EE performance problems I have encountered working with IT & Telecom clients over the last 10 years along with high level recommendations.Please note that this article is in-depth but I'm confident that this substantial read will be worth your time.I'm confident that many of you can identify episodes of performance problems following Java EE project deployments. Some of these performance problems could have a very specific and technical explanation but are often symptoms of gaps in the current capacity planning of the production environment.Capacity planning can be defined as a comprehensive and evolutive process measuring and predicting current and future required IT environment capacity. A proper implemented capacity planning process will not only ensure and keep track of current IT production capacity and stability but also ensure that new projects can be deployed with minimal risk in the existing production environment. Such exercise can also conclude that extra capacity (hardware, middleware, JVM, tuning, etc.) is required prior to project deployment.In my experience, this is often the most common "process" problem that can lead to short- and long- term performance problems. The following are some examples. 
Problems observed
Possible capacity planning gaps
A newly deployed application triggers an overload to the current Java Heap or Native Heap space (e.g.,java.lang.OutOfMemoryError is observed).
-Lack of understanding of the current JVM Java Heap (YoungGen and OldGen spaces) utilization
-Lack of memory static and / or dynamic footprint calculation of the newly deployed application
-Lack of performance and load testing preventing detection of problems such as Java Heap memory leak
A newly deployed application triggers a significant increase of CPU utilization and performance degradation of the Java EE middleware JVM processes.
-Lack of understanding of the current CPU utilization (e.g., established baseline)
-Lack of understanding of the current JVM garbage collection healthy (new application / extra load can trigger increased GC and CPU)
-Lack of load and performance testing failing to predict the impact on existing CPU utilization
A new Java EE middleware system is deployed to production but unable to handle the anticipated volume.
-Missing or non-adequate performance and load testing performed
-Data and test cases used in performance and load testing not reflecting the real world traffic and business processes
-Not enough bandwidth (or pages are much bigger than capacity planning anticipated)
One key aspect of capacity planning is load and performance testing that everybody should be familiar with. This involves generating load against a production-like environment or the production environment itself in order to: 
  • Determine how much concurrent users / orders volumes your application(s) can support
  • Expose your platform and Java EE application bottlenecks, allowing you to take corrective actions (middleware tuning, code change, infrastructure and capacity improvement, etc.)
 There are several technologies out there allowing you to achieve these goals. Some load-testing products allow you to generate load from inside your network from a test lab while other emerging technologies allow you to generate load from the "Cloud".I'm currently exploring the free version of Load Tester, a new load testing tool I found allowing you to record test cases and generate load from inside your network or from the Cloud. 
Regardless of the load and performance testing tool that you decide to use, this exercise should be done on a regular basis for any dynamic Java EE environments and as part of a comprehensive and adaptive capacity planning process. When done properly, capacity planning will help increase the service availability of your client IT environment.The second most common cause of performance problems I have observed for Java EE enterprise systems is an inadequate Java EE middleware environment and / or infrastructure. Not making proper decisions at the beginning of new platform can result in major stability problems and increased costs for your client in the long term. For that reason, it is important to spend enough time brainstorming on required Java EE middleware specifications. This exercise should be combined with an initial capacity planning iteration since the business processes, expected traffic, and application(s) footprint will ultimately dictate the initial IT environment capacity requirements.
 Now, find below typical examples of problems I have observed in my past experience: 
  • Deployment of too many Java EE applications in a single 32-bit JVM
  • Deployment of too many Java EE applications in a single middleware domain
  • Lack of proper vertical scaling and under-utilized hardware (e.g., traffic driven by one or just a few JVM processes)
  • Excessive vertical scaling and over-utilized hardware (e.g., too many JVM processes vs. available CPU cores and RAM)
  • Lack of environment redundancy and fail-over capabilities
 Trying to leverage a single middleware and / or JVM for many large Java EE applications can be quite attractive from a cost perspective. However, this can result in an operation nightmare and severe performance problems such as excessive JVM garbage collection and many domino effect scenarios (e.g., Stuck Threads) causing high business impact (e.g., App A causing App B, App C, and App D to go down because a full JVM restart is often required to resolve problems). Recommendations
  • Project team should spend enough time creating a proper operation model for the Java EE production environment.
  • Attempt to find a good "balance" for your Java EE middleware specifications to provide to the business & operation team proper flexibility in the event of outages scenarios.
  • Avoid deployment of too many Java EE applications in a single 32-bit JVM. The middleware is designed to handle many applications, but your JVM may suffer the most.
  • Choose a 64-bit over a 32-bit JVM when it is required but combine with proper capacity planning and performance testing to ensure your hardware will support it.
 Now let's jump to pure technical problems starting with excessive JVM garbage collection. Most of you are familiar with this famous (or infamous) Java error: java.lang.OutOfMemoryError. This is the result of JVM memory space depletion (Java Heap, Native Heap, etc.). I'm sure middleware vendors such as Oracle and IBM could provide you with dozens and dozens of support cases involving JVM OutOfMemoryError problems on a regular basis, so no surprise that it made the #3 spot in our list.Keep in mind that a garbage collection problem will not necessarily manifest itself as an OOM condition. Excessive garbage collection can be defined as an excessive number of minor and / or major collections performed by the JVM GC Threads (collectors) in a short amount of time leading to high JVM pause time and performance degradation. There are many possible causes: 
  • Java Heap size chosen is too small vs. JVM concurrent load and application(s) memory footprint.
  • Inappropriate JVM GC policy used.
  • Your application(s) static and / or dynamic memory footprint is too big to fit in a 32-bit JVM.
  • The JVM OldGen space is leaking over time * quite common problem *; excessive GC (major collections) is observed after few hours / days.
  • The JVM PermGen space (HotSpot VM only) or Native Heap is leaking over time * quite common problem *; OOM errors are often observed over time following application dynamic redeployments.
  • Ratio of YoungGen / OldGen space is not optimal to your application(s) (e.g., a bigger YoungGen Space is required for applications generating massive amount of short lived objects). A bigger OldGen space is required for applications creating lot of long lived / cached Objects.
  • The Java Heap size used for a 32-bit VM is too big leaving small room for the Native Heap. Problems can manifest as OOM when trying to a new Java EE application, creating new Java Threads or any computing task that requires native memory allocations.
 Before pointing a finger at the JVM, keep in mind that the actual "root" cause can be related to our #1 & #2 causes. An overloaded middleware environment will generate many symptoms, including excessive JVM garbage collection.Proper analysis of your JVM related data (memory spaces, GC frequency, CPU correlation, etc.) will allow you to determine if you are facing a problem or not. Deeper level of analysis to understand your application memory footprint will require you to analyze JVM Heap Dumps and / or profile your application using profiler tools (such as JProfiler) of your choice. Recommendation
  • Ensure that you monitor and understand your JVM garbage collection very closely. There are several commercial and free tools available to do so. At the minimum, you should enable verbose GC, which will provide all the data that you need for your health assessment
  • Keep in mind that GC related problems are unlikely to be caught during development or functional testing. Proper garbage collection tuning will require you to perform load and perform testing with high-volume from simultaneous users. This exercise will allow you to fine-tune your Java Heap memory footprint as per your applications behaviour and load level forecast.
 The next common cause of bad Java EE performance is mainly applicable for highly distributed systems; typical for Telecom IT environments. In such environments, a middleware domain (e.g., Service Bus) will rarely do all the work but rather "delegate" some of the business processes, such as product qualification, customer profile, and order management, to other Java EE middleware platforms or legacy systems such as Mainframe via various payload types and communication protocols. Such external system calls means that the client Java EE application will trigger creation or reuse of Socket Connections to write and read data to/from external systems across a private network. Some of these calls can be configured as synchronous or asynchronous depending of the implementation and business process nature. It is important to note that the response time can change over time depending on the health of the external systems, so it is very important to shield your Java EE application and middleware via proper use of timeouts.
Major problems and performance slowdown can be observed in the following scenarios: 
  • Too many external system calls are performed in asynchronousand sequentialmanner. Such implementation is also fully exposed to instability and slowdown of its external systems.
  • Timeouts between Java EE client applications and external systems are missing or values are too high. This will cause client Threads to get Stuck, which can lead to a full domino effect.
  • Timeouts are properly implemented but middleware is not fine-tuned to handle the "non-happy" path. Any increase of response time (or outage) of external system will lead to increased Thread utilization and Java Heap utilization (increased # of pending payload data). Middleware environment and JVM must be tuned in a way to predict and handle both "happy" and "non-happy" paths to prevent a full domino effect.
 Finally, I also recommend that you spend adequate time performing negative testing. This means that problem conditions should be "artificially" introduced to the external systems in order to test how your application and middleware environment handle failures of those external systems. This exercise should also be performed under a high-volume situation, allowing you to fine-tune the different timeout values between your applications and external systems.The next common performance problem should not be a surprise for anybody: database issues. Most Java EE enterprise systems rely on relational databases for various business processes from portal content management to order provisioning systems. A solid database environment and foundation will ensure that your IT environment will scale properly to support your client growing business.  In my production support experience, database-related performance problems are very common. Since most database transactions are typically executed via JDBC Datasources (including for relational persistence API's such as Hibernate), performance problems will initially manifest as Stuck Threads from your Java EE container Thread manager. The following are common database-related problems I have seen over the last 10 years:* Note that Oracle database is used as an example since it is a common product used by my IT clients.* 
  • Isolated, long-running SQLs. This problem will manifest as stuck Threads and usually a symptom of lack of SQL tuning, missing indexes, non-optimal execution plan, returned dataset too large, etc.
  • Table or row level data lock. This problem can manifest especially when dealing with a two-phase commit transactional model (ex: infamous Oracle In-Doubt Transactions). In this scenario, the Java EE container can leave some pending transactions waiting for final commit or rollback, leaving data lock that can trigger performance problems until such locks are removed. This can happen as a result of a trigger event such as a middleware outage or server crash.
  • Sudden change of execution plan. I have seen this problem quite often and usually the result of some data patterns changes, which can (for example) cause Oracle to update the query execution plan on the fly and trigger major performance degradation.
  • Lack of proper management of the database facilities. For example, Oracle has several areas to look at such as REDO logs, database data files, etc. Problems such as lack of disk space and log file not rotating can trigger major performance problems and an outage situation.
 Recommendations
  • Proper capacity planning involving load and performance testing is critical here to fine-tune your database environment and detect any problems at the SQL level.
  • If you are using Oracle databases, ensure that your DBA team is reviewing the AWR Report on a regular basis, especially in the context of an incident and root cause analysis process. Same analysis approach should also be performed for other database vendors.
  • Take advantage of JVM Thread Dump and AWR Report to pinpoint the slow running SQLs and / or use a monitoring tool of your choice to do the same. 
  • Make sure to spend enough time to fortify the "Operation" side of your database environment (disk space, data files, REDO logs, table spaces, etc.) along with proper monitoring and alerting. Failure to do so can expose your client IT environment to major outage scenarios and many hours of downtime.

To recap, so far we have seen the importance of proper capacity planning, load and performance testing, middleware environment specifications, JVM health, external systems integration, and the relational database environment. But what about the Java EE application itself? After all, your IT environment could have the fastest hardware on the market with hundreds of CPU cores, large amount of RAM, and dozens of 64-bit JVM processes; but performance can still be terrible if the application implementation is deficient. This section will focus on the most severe Java EE application problems I have been exposed to from various Java EE environments.My primary recommendation is to ensure that code reviews are part of your regular development cycle along with release management process. This will allow you to pinpoint major implementation problems as per below and prior to major testing and implementation phases. Thread safe code problemsProper care is required when using Java synchronization and non-final static variables / objects. In a Java EE environment, any static variable or object must be Thread safe to ensure data integrity and predictable results. Wrong usage of static variable for a Java class member variable can lead to unpredictable results under load since these variables/objects are shared between Java EE container Threads (e.g., Thread B can modify static variable value of Thread A causing unexpected and wrong behavior). A class member variable should be defined as non static to remain in the current class instance context so each Thread has its own copy.Java synchronization is also quite important when dealing with non-Thread safe data structure such as a java.util.HashMap. Failure to do so can trigger HashMap corruption and infinite looping. Be careful when dealing with Java synchronization since excessive usage can also lead to stuck Threads and poor performance. Lack of communication API timeoutsIt is very important to implement and test transaction (Socket read () and write () operations) and connection timeouts (Socket connect () operation) for every communication API. Lack of proper HTTP/HTTPS/TCP IP... timeouts between the Java EE application and external system(s) can lead to severe performance degradation and outage due to stuck Threads. Proper timeout implementation will prevent Threads to wait for too long in the event of major slowdown of your downstream systems.Below are some examples for some older and current APIs (Apache & Weblogic):
Communication API
Vendor
Protocol
Timeout code snippet
commons-httpclient 3.0.1
Apache
HTTP/HTTPS
HttpConnectionManagerParams.setSoTimeout(txTimeout); // Transaction timeout
HttpConnectionManagerParams.setConnectionTimeout(connTimeout);// Connection timeout
axis.jar (v1.4 1855)
Apache
WS via HTTP/HTTPS
*** Please note that version 1.x of AXIS is exposed to a known problem with SSL Socket creation which ignores the specified timeout value. Solution is to override the client-config.wsdd and setup the HTTPS transport to <transport name="https" pivot="java:org.apache.axis.transport.http.CommonsHTTPSender"/> ***
((org.apache.axis.client.Stub) port).setTimeout(timeoutMilliseconds); // Transaction & connection timeout
WLS103 (old JAX-RPC)
Oracle
WS via HTTP/HTTPS
// Transaction & connection timeout
((Stub)servicePort)._setProperty("weblogic.webservice.rpc.timeoutsecs", timeoutSecs);
WLS103 (JAX-RPC 1.1)
Oracle
WS via HTTP/HTTPS
((Stub)servicePort)._setProperty("weblogic.wsee.transport.read.timeout", timeoutMills); // Transaction timeout
((Stub)servicePort)._setProperty("weblogic.wsee.transport.connection.timeout", timeoutMills); // Connection timeout
I/O, JDBC or relational persistence API resources management problemsProper coding best practices are important when implementing a raw DAO layer or using relational persistence APIs such as Hibernate. The goal is to ensure proper Session / Connection resource closure. Such JDBC related resources must be closed in a finally {} block to properly handle any failure scenario. Failure to do so can lead to JDBC Connection Pool leak and eventually stuck Threads and full outage scenario.Same rule apply to I/O resources such as InputStream. When no longer used, proper closure is required; otherwise, it can lead so Socket / File Descriptor leak and full JVM hang. Lack of proper data cachingPerformance problems can be the result of repetitive and excessive computing tasks, such as I/O / disk access, content data from a relational database, and customer-related data. Static data with reasonable memory footprint should be cached properly either in the Java Heap memory or via a data cache system.Static files such as property files should also be cached to prevent excessive disk access. Simple caching strategies can have a very positive impact on your Java EE application performance.Data caching is also important when dealing with Web Services and XML-related APIs. Such APIs can generate excessive dynamic Class loading and I/O / disk access. Make sure that you follow such API best practices and use proper caching strategies (Singleton, etc.) when applicable. I suggest you read JAXB Case Study on that subject.Excessive data cachingIronically, while data caching is crucial for proper performance, it can also be responsible for major performance problems. Why? Well, if you attempt to cache too much data on the Java Heap, then you will be struggling with excessive garbage collections and OutOfMemoryError conditions. The goal is to find a proper balance (via your capacity planning process) between data caching, Java Heap size, and available hardware capacity.Here is one example of a problem case from one of my IT clients:
  • Very poor performance was observed from the Weblogic portal application.
  • Data caching was implemented to improve performance with initial positive impact.
  • The more products they were adding in their product catalogue, bigger data caching requirements and Java Heap memory resulted.
  • Eventually, the IT team had to upgrade to 64-bit JVM with 8 GB per JVM process along with more CPU cores.
  • Eventually, the situation was not sustainable and design had to be reviewed.
  • The final solution ended up using a distributed data cache system, outside the Java EE middleware and JVM via separate hardware.
 The important point to remember from this story is that when too much data caching is required to achieve proper performance level, it is time to review the overall solution and design.Excessive loggingLast but not the least: excessive logging. It is a good practice to ensure proper logging within your Java EE application implementation. However, be careful with the logging level that you enable in your production environment. Excessive logging will trigger high IO on your server and increase CPU utilization. This can especially be a problem for older environments using older hardware or environments dealing with very heavy concurrent volumes. I also recommend that you implement a "reloadable" logging level facility to turn extra logging ON / OFF when required in your day to day production support.It is important to realize that your Java EE middleware specifications may be adequate but may lack proper tuning. Most Java EE containers available today provide you with multiple tuning opportunities depending on your applications and business processes needs.Failure to implement proper tuning and best practices can put your Java EE container in a non-optimal state. I highly recommend that you review and implement proper Java EE middleware vendor recommendations when applicable.Find below a high-level view and sample check list of what to look for. 
Lack of monitoring is not actually "causing" performance problems, but it can prevent you from understanding the Java EE platform capacity and health situation. Eventually, the environment can reach a break point, which may expose several gaps and problems (JVM memory leak, etc.). From my experience, it is much harder to stabilize an environment after months or years of operation as opposed to having proper monitoring, tools, and processes implemented from day one.That being said, it is never too late to improve an existing environment. Monitoring can be implemented fairly easily. My recommendations follow. 
  • Review your current Java EE environment monitoring capabilities and identify improvement opportunities.
  • Your monitoring solution should cover the end-to-end environment as much as possible; including proactive alerts.
  • The monitoring solution should be aligned with your capacity planning process discussed in our first section.
 Another common source of performance problems is hardware saturation. This problem is often observed when too many Java EE middleware environments along with its JVM processes are deployed on existing hardware. Too many JVM processes vs. availability of physical CPU cores can be a real problem killing your application performance. Again, your capacity planning process should also take care of hardware capacity as your client business is growing.My primary recommendation is to look at hardware virtualization. Such an approach is quite common these days and has quite a few benefits such as reduced physical servers, data center size, dedicated physical resources per virtual host, fast implementation, and reduced costs for your client. Dedicated physical resources per virtual host is quite important since the last thing you want is one Java EE container bringing down all others due to excessive CPU utilization. 
Our last source of performance problems is the network. Major network problems can happen from time to time such as router, switch, and DNS server failures. However, the more common problems observed are typically due to regular or intermittent latency when working on a highly distributed IT environment. The diagram below highlights an example of network latency gaps between two geographic regions of a Weblogic cluster communicating with an Oracle database server located in one geographic region only.  Intermittent or regular latency problems can definitely trigger some major performance problems and affect your Java EE application in different ways. 
  • Applications using database queries with large datasets are fully exposed to network latency due to high number of fetch iterations (back and forward across network).
  • Applications dealing with large data payloads (such as large XML data) from external systems are also exposed to network latency that can trigger intermittent high-response time when sending and receiving responses.
  • Java EE container replication process (clustering) can be affected and put at risk its fail-over capabilities (e.g., multicast or unicast packet losses).
 Tuning strategies such as JDBC row data "prefetch", XML data compression, and data caching can help mitigate network latency. But such latency problems should be reviewed closely when first designing the network topology of a new IT environment.I hope this article has helped you understand some of the common performance problems and pressure points you can face when developing and supporting Java EE production systems. Since each IT environment is unique, I do not expect that everybody will face the exact same problems. As such, I invite you to post your comments and share your views on the subject.#1 - Lack of proper capacity planning#2 - Inadequate Java EE middleware environment specifications#3 - Excessive Java VM garbage collections#4 - Too many or poor integration with external systems#5 - Lack of proper database SQL tuning & capacity planning#6 - Application specific performance problems#7 - Java EE middleware tuning problems#8 - Insufficient proactive monitoring#9 - Saturated hardware on common infrastructure#10 - Network latency problems