An impediment is anything that prevents people from doing their job. Here are some impediments that performance testing teams have encountered.
A. Unavailability of subject matter / technical experts such as developers and operations staff.
B. Unavailability of applications to test due to delays or defects in the functionality of the system under test.
C. Lack of Connectivity/access to resources due to network security ports being available or other network blockage.
D. The script recorder fails to recognize applications (due to non-standard security apparatus or other complexity in the application).
E. Not enough Test Data to cover unique conditions necessary during runs that usually go several hours.
F. Delays in obtaining or having enough software licenses and hardware in the performance environment testing.
G. Lack of correspondence between versions of applications in performance versus in active development.
H. Managers not familiar with the implications of ad-hoc approaches to performance testing.
Fight Or Flight? Proactive or Reactive?
Some call the list above "issues" which an organization may theoretically face.
Issues become "risks" when they already impact a project.
A proactive management style at a particular organization sees value in investing up-front to ensure that desired outcomes occur rather than "fight fires" which occur without preparation.
A reactive management style at a particular organization believes in "conserving resources" by not dedicating resources to situations that may never occur, and addressing risks when they become actual reality.
Subject Matter Expertise
The Impediment
Knowledge about a system and how it works are usually not readily available to those outside the development team.
What documents written are often one or more versions behind what is under development.
Requirements and definitions are necessary to separate whether a particular behavior is intended or is a deviation from that requirement.
Even if load testers have access to up-to-the-minute wiki entries, load testers usually are not free to interact as a peer of developers.
Load testers are usually not considered a part of the development team or even the development process, so are therefore perceived as an intrusion to developers.
To many developers, Performance testers are a nuisence who waste time poking around a system that is "already perfect" or "one we already know that is slow".
What can reactive load testers do?
Work among developers and easedrop on their conversations (like those studying animals in the wild).
What can proactive load testers do?
Up-front, an executive formally establishes expectations for communication and coordination between developers and load testers.
Ideally, load testers participate in the development process from the moment a development team is formed so that they are socially bonded with the developers.
Recognizing that developers are under tight deadlines, the load test team member defines exactly what is needed from the developer and when it is needed.
This requires up-front analysis of the development organization:
o the components of the application
o which developers work on which component
o contact information for each developer
o existing documents available and who wrote each document
o comments in blogs written by each developer
An executive assigns a "point person" within the development organization who can provide this information.
Assignments for each developer needs to originate from the development manager under whom a developer works for.
When one asks/demands something without the authority to do so, that person would over time be perceived as a nuisence.
No one can serve two masters. For you will hate one and love the other; you will be devoted to one and despise the other.
A business analyst who is familiar with the application's intended behavior makes a video recording of the application using a utility such as Camtasia from ToolSmith. A recording has the advtange of capturing the timing as well as the steps.
The U.S. military developed the web-based CAVNET system to collaborate on innovations to improvise around impediments found in the found.
Availability of applications
The Impediment
Parts of an applications under active development become inacessible while developers are in the middle of working on them.
The application may not have been built successfully. There are many root causes for bad builds:
o Specification of what goes into each build are not accurate or complete.
o Resources intended to go into a particular build are not made available.
o An incorrect version of a component is built with newer incompatible components.
o Build scripts and processes do not recognize these potential errors, leading to build errors.
o Inadequate verification of build completeness.
What can reactive load testers do?
Frequent (nightly) builds may enable testers more opportunities than losing perhaps weeks wait for the next good build.
Testers switch to another project/application when one application cannot be tested.
What can proactive load testers do?
Use a separate test environment that is updated from the development system only when parts of the application become stable enough to test.
Have a separate test environment for each version so that work on a prior version can occur when a build is not successful on one particular environment.
Develop a "smoke test" suite to ensure that applications are testable.
Coordinate testing schedules with what is being changed by developers.
Analyze the root causes of why builds are not successful, and track progress on elminating those causes over time.
Connectivity/access to resources
The Impediment
Workers may not be able to reach the application because of network (remote VPN) connectivity or security access.
What can reactive load testers do?
Work near the physical machine.
Grant unrestricted access to those working on the system.
What can proactive load testers do?
Analyze the access for each functionality required by each role.
Pre-schedule when those who grant access are available to the project.
Script Recorder Recognition
The Impediment
Load test script creation software such as LoadRunner work by listening and capturing what goes across the wire and display those conversations as script code which may be modified by humans.
Such recording mechanisms are designed to recognize only standard protocols going through the wire.
Standard recording mechanisms will not recognize custom communications, especially within applications using advanced security mechanisms.
Standard recording mechanisms also have difficulty recognizing complex use of Javascript or CSS syntax in SAP portal code.
What can reactive load testers do?
Skip (de-scope) portions which cannot be easily recognized.
What can proactive load testers do?
To ensure that utility applications (such as LoadRunner) can be installed, install them before locking down the system.
Define the pattern install them before locking down the system.
Test Data
The Impediment
Applications often only allow a certain combination of values to be accepted. An example of this is only specific postal zip codes being valid within a certain US state.
Using the same value repeatedly during load testing does not create a realistic emulation of actual behavior because most modern systems cache data in memory, which is 100 times faster than retrieving data from a hard drive.
This discussion also includes role permissions having a different impact on the system. For example, the screen of an administrator or manager would have more options. The more options, the more resources it takes just to display the screen as well as to edit input fields.
A wide variation in data values forces databases to take time to scan through files. Specifying an index used to retrieve data is the most common approach to make applications more efficient.
Growth in the data volume handled by a system can render indexing schemes inefficient at the new level of data.
What can reactive load testers do?
Use a single role for all testing.
Qualify results from each test with the amount of data used to conduct each test.
Use trial-and-error approachs to finding combinations of values which meet field validation rules.
Examine application source code to determine the rules.
Analyze existing logs to define the distribution of function invocations during test runs.
What can proactive load testers do?
Project the likely growth of the application in terms of impact to the number of rows in each key data variable. This information is then used to define the growth in row in each table.
Define procedures for growing the database size, using randomized data values in names.
Test Environment
The Impediment
Creating a separate enviornment for load testing can be expensive for a large complex system.
In order to avoid overloading the production network, the load testing enviornment is often setup so no communication is possible to the rest of the network. This makes it difficult to deploy resources into the environment and then retrieve run result files from the environment.
A closed environment requires its own set of utility services such as DNS, authentication (LDAP), time sychronization, etc.
What can reactive load testers do?
Change network firewalls temporarily while using the development environment for load testing (when developers do not use it).
Use the production fail-over environment temporarily and hope that it is not needed during the test.
What can proactive load testers do?
Build up a production environment and use it for load testing before it is used in actual production.
Correspondance Between Versions
The Impediment
Defects found in the version running on the perftest environment may not be reproducible by developers in the development/unit test environments running a different (more recent) version.
Developers may have moved on to a different version, different projects, or even different employers.
What can reactive load testers do?
Rerun short load tests on development servers. If the server is shared, the productivity of developers would be affected.
What can proactive load testers do?
Before testing, freeze the total state of the application in a full back-up so that the exact state of the system can be restored, even after changes are tried to diagnose or fix the application on the system where it's found.
Run load tests with trace logs information. This would not duplicate how the system is actually run in production mode.
Ad-hoc Approaches
The Impediment
Most established professional fields (such as accounting and medicine) have laws, regulations, and defined industry practices which give legitimacy to certain approaches. People are trained to follow them. The consequences of certain courses of action are known.
But the profession of performance and load testing has not matured to that point.
The closest industry document, ITIL, is not yet universally adopted. And ITIL does not clarify the work of performance testing in much detail.
Consequently, each individual involved with load testing is likely to have his/her own opinions about what actions should be taken.
This makes rational exploration of the implications of specific courses of action a conflict-ridden and thus time-consuming and expensive endeavor.
What can reactive load testers do?
Allocate time for planning before starting actual work until concurrance on the project plan is achieved among the stakeholders.
Revise project completion estimates or scope as new information becomes available.
What can proactive load testers do?
Before the project gets away, agree on the rationale for elements of the project plan and who will do what when (commitments of tasks and deliverables). This is difficult for those who are not accustomed to being accountable, and requests for it would result in withdrawl or other defensive behavior.
Identify alternative approaches and analyze them before managers come up with it themselves.
Up-front, identify how to contact each stakeholder and keep them updated at least weekly, and immediately if decisions impact what they are actively working on.
If a new manager is inserted in the project after it starts, review the project plan and rationale for its elements.
 Fig: Java Visual VM
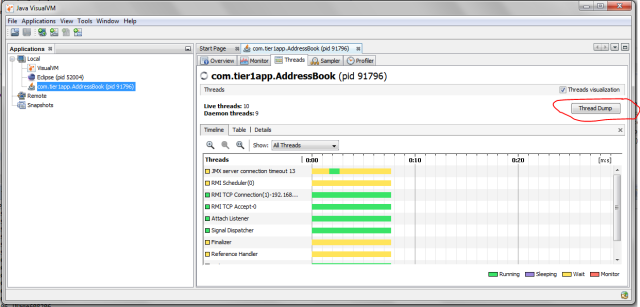
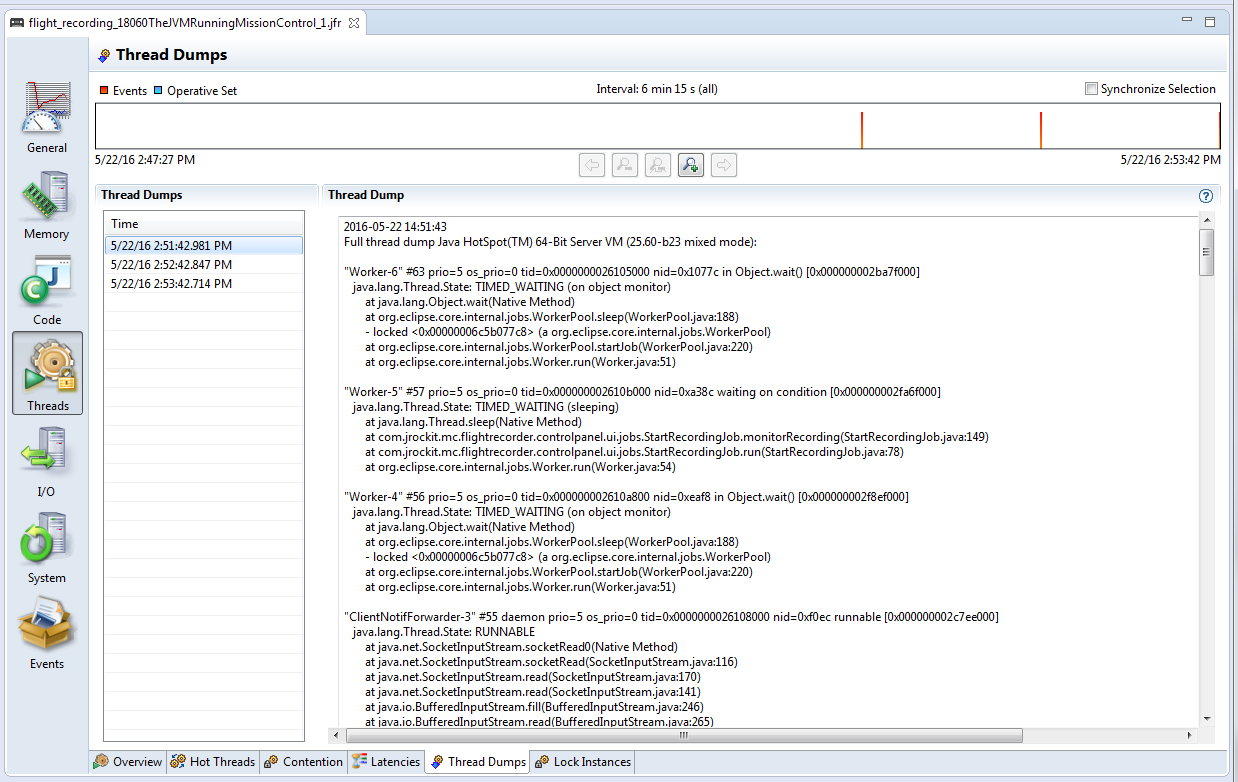
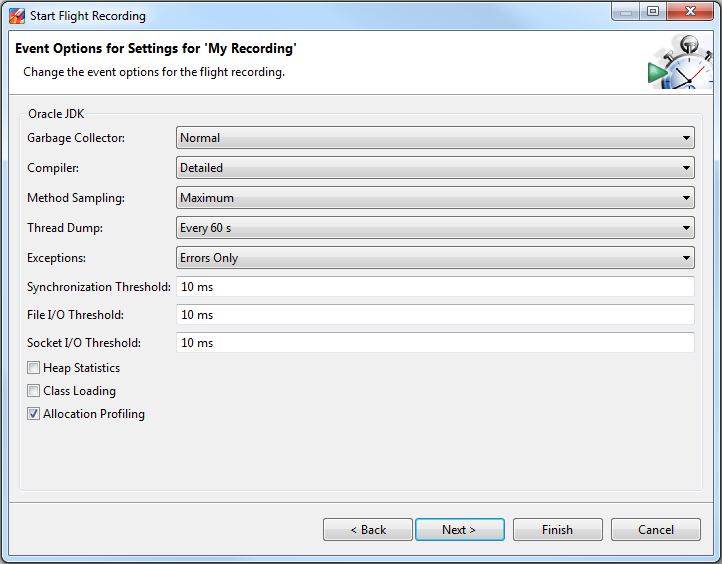 Fig: Flight Recorder wizard showing ‘Thread Dump’ capture option.