Contents of JMeter GUI

What is mean by Test Plan & WorkBench in JMeter. We are covering how to add and remove JMeter Elements, How to Load and Save JMeter Elements. Alongwith that we are covering how we configure Jmeter Elements. Finally we will see How to save a JMeter Test Plan, Running & stopping Test in JMeter.

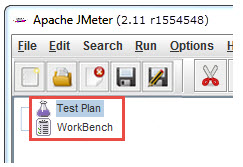
After opening JMeter. Firstly, our eyes go to these two Elements,

  • Test Plan
  • Workbench


Test Plan

A test plan shows a series of Elements are useful in application tasting process. These Elements are: Thread Groups, logic controllers, sample generating controllers, listeners, timers, assertions, and configuration elements.
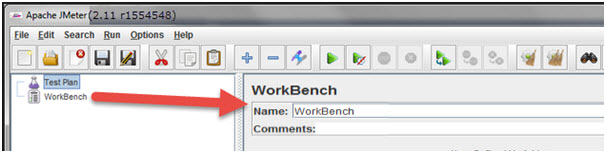


WorkBench
The WorkBench is simply a place which creates space to temporarily store test elements at the time of constructing test. In other word, it is a sandbox or portion of a test on which you are working on. That’s why, if the designed test in the WorkBench is ready to proceed, copy that and move it into Test Plan. Jmeter only save the contents of Test Plan not WorkBench.

WorkBench keeps non-test Elements too: Http Mirror Server and Http Mirror Server, these elements are not available in the Thread Group and Test Plan.


Add and Remove JMeter Elements
Adding Elements in Test Plan is very important step to execute your Test Plan. Without going through this, JMeter is unable to execute your Test Plan. A Test Plan is capable to include many Elements such as Listener, Controller, and Timer. To add Element in the Test Plan, right click on Test Plan which opens context-menu of Test Plan, then choose new elements from “Add” list. Alternatively, elements can be loaded from file and added by choosing the “merge” or “open” option.

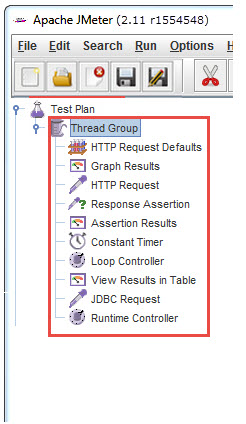
Before adding any Element in the Test Pane, it is necessary to add first a Thread Group element. The Thread Group says JMeter the number of users you need to simulate, how frequently the users should send requests, and how many requests they should send.

So, first let us know how to add the Thread Group element, right click on Test Plan which opens context-menu of Test Plan and then select Add –>Thread Group.

After adding the Thread Group, the Thread Group should display under Test Plan. If it is not visible, then “expand” the Test Plan tree by clicking on the Test Plan element.

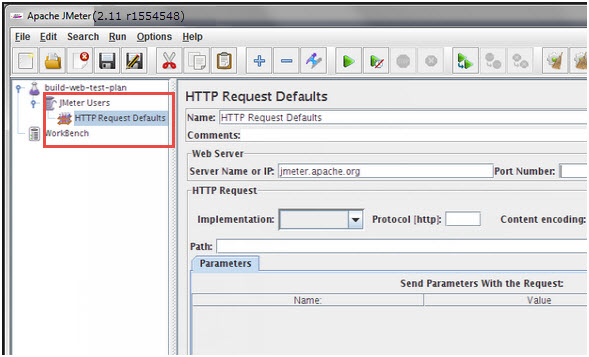
After defining Users, define the task on which they will work. Let us take an example of HTTP Request Defaults Element, add this element by right clicking on Users and then choose Add –>Config Element –> HTTP Request Defaults.


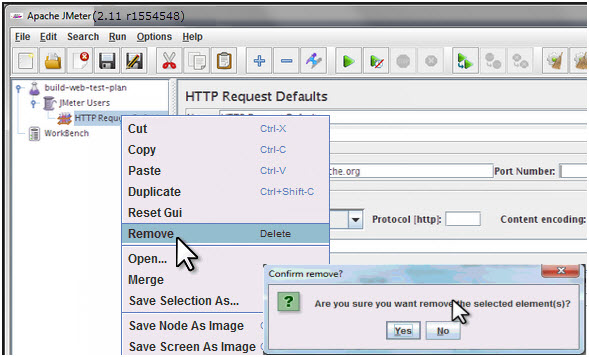
As like adding, you can also remove the Element which is not required. Let us take an example of “HTTP Request Defaults” Element. To remove this Element, right click on “HTTP Request Defaults” and from context-menu choose “Remove” option. It will display the dialog box with message “Are you sure you want to remove the selected Element”, if yes, then click on “Yes” button, or if no, then click on “No” button

Click Yes to confirm delete this element on message box.


Load and Save JMeter Elements
a) Load Elements
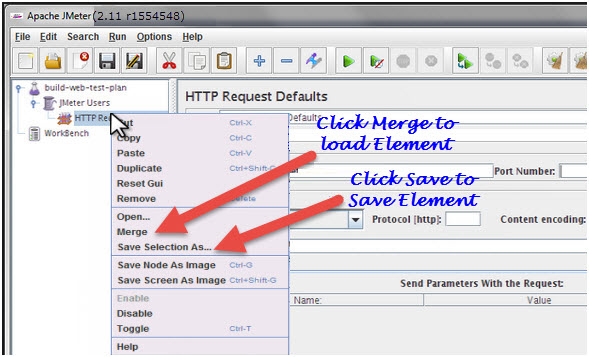
To load the element from existing file, choose the element from existing tree on which you want to load the other element, then right click on the selected element and click on “Merge” option. Choose the file from the existing saved Element. JMeter will merge the elements into the tree.


b) Save Elements
To save tree elements, choose the element from the tree, right click on an element and from the context menu option choose the “Save Selection As…”option. JMeter will save the selected element, plus all child elements beneath it. Created file cannot be saved in jmeter by default; you have to explicitly save the element.

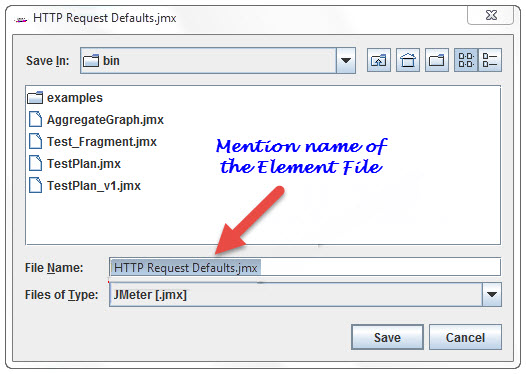
When you save the element, it will save with the default name of the element, you can save with the same name or you can change it. For example, The figure below shows the save dialog box with default name “HTTP Request Defaults.jmx”. Either you can give the same name or can change it before clicking on “Save” button.


JMeter Test Elements and Test plan are stored in *.JMX format. JMX is standing forJava Management Extensions.

Configure Jmeter Elements
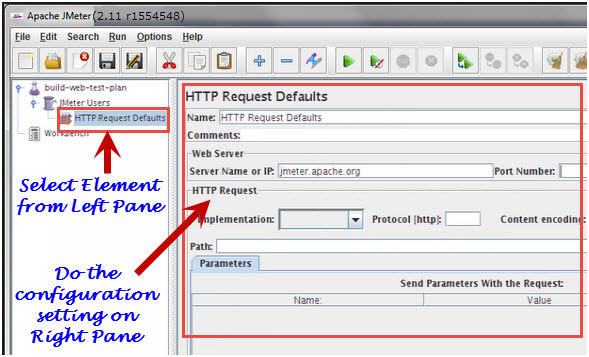
To configure any Element, first select the element of the Tree from Left Pane and do the configuration settings of the same element in the Right Pane.


You can configure any element of the Test Plan, using the element frame present in the right side of the JMeter window. These frames facilitate to configure the nature of the specific test element.

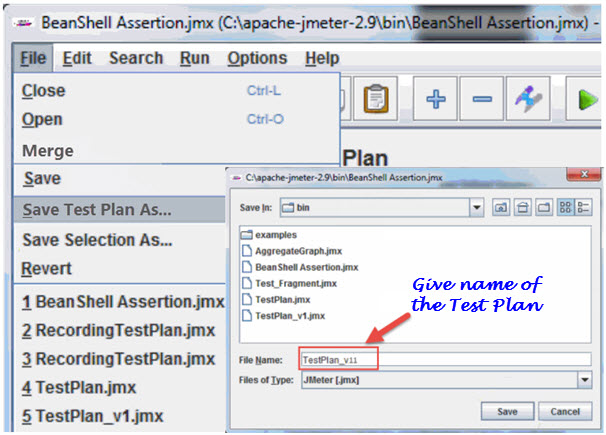
Saving the Test Plan
First save the Test Plan, before running a test. This saving helps to avoid surprising error comes at the time of running the test plan. To save the Test plan, first go to the File ->Save Test Plan. It displays the save Dialog box,give the file name of Test Plan and click on “Save”.
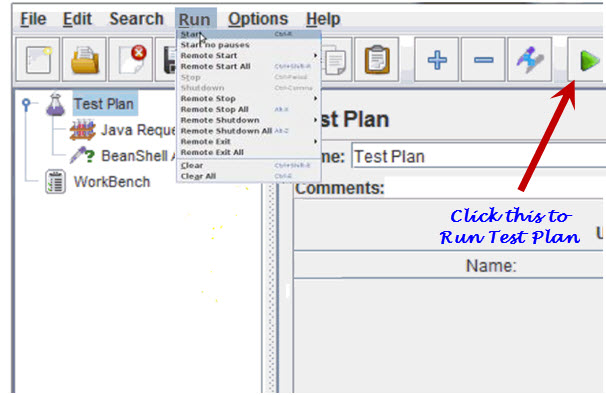

Running a Test Plan
To run the Test Plan, from top of the menu item click on Run à Start or from the keyboard press “Control+R”. Also, JMeter shows a small green button at the right hand side just under the menu bar – this is an alternative tool to Run Test Plan.


Stopping a Test

There are two ways to stop running test,

First Way: Click on “Stop”, or from keyboard press Control + ‘.’. This is an immediately process to stops the threads, if possible.

Second Way: Shutdown,or press –> Control + ‘,’. This appeals the threads to stop at the end of any present work.


If you enjoy reading article then you can subscribe our updates for FREE, just add your email id below. If you need any specific point to be cover around JMeter GUI in detailed then let me know in comments below. I will keep on updating the article for latest testing information.

How to connect the PC Host with PC11 if fire wall is the bottleneck?

How to connect the PC Host with PC11 if fir wall is the bottleneck?


What is Junit Test Framework?

JUnit is a Regression Testing Framework used by developers to implement unit testing in Java and accelerate programming speed and increase the quality of code. JUnit Framework can be easily integrated with either of the followings:

1.Eclipse
2.Ant
3.Maven

Features:JUnit test framework provides following important features
  1. Fixtures
  2. Test suites
  3. Test runners
  4. JUnit classes
  5. Fixtures
Fixtures is a fixed state of a set of objects used as a baseline for running tests. The purpose of a test fixture is to ensure that there is a well known and fixed environment in which tests are run so that results are repeatable. It includes

setUp() method which runs before every test invocation.

tearDown() method which runs after every test method.

Let's check one example:import junit.framework.*; public class JavaTest extends TestCase { protected int value1, value2; // assigning the values protected void setUp(){ value1=3; value2=3; } // test method to add two values public void testAdd(){ double result= value1 + value2; assertTrue(result == 6); } }

Test suite:

Test suite means bundle a few unit test cases and run it together. In JUnit, both @RunWith and @Suite annotation are used to run the suite test. Here is an example which uses TestJunit1 & TestJunit2 test classes.import org.junit.runner.RunWith; import org.junit.runners.Suite; //JUnit Suite Test @RunWith(Suite.class) @Suite.SuiteClasses({ TestJunit1.class ,TestJunit2.class }) public class JunitTestSuite { }
import org.junit.Test; import org.junit.Ignore; import static org.junit.Assert.assertEquals; public class TestJunit1 { String message = "Robert"; MessageUtil messageUtil = new MessageUtil(message); @Test public void testPrintMessage() { System.out.println("Inside testPrintMessage()"); assertEquals(message, messageUtil.printMessage()); } }
import org.junit.Test; import org.junit.Ignore; import static org.junit.Assert.assertEquals; public class TestJunit2 { String message = "Robert"; MessageUtil messageUtil = new MessageUtil(message); @Test public void testSalutationMessage() { System.out.println("Inside testSalutationMessage()"); message = "Hi!" + "Robert"; assertEquals(message,messageUtil.salutationMessage()); } }

Test runner:

Test runner is used for executing the test cases. Here is an example which assumes TestJunit test class already exists.import org.junit.runner.JUnitCore; import org.junit.runner.Result; import org.junit.runner.notification.Failure; public class TestRunner { public static void main(String[] args) { Result result = JUnitCore.runClasses(TestJunit.class); for (Failure failure : result.getFailures()) { System.out.println(failure.toString()); } System.out.println(result.wasSuccessful()); } }

JUnit classes:

JUnit classes are important classes which is used in writing and testing JUnits. Some of the important classes are

Assert which contain a set of assert methods.

TestCase which contain a test case defines the fixture to run multiple tests.

TestResult which contain methods to collect the results of executing a test case

Run Vugen from command prompt in load runner

Run Vugen from command prompt

Here is the command to run vugen from the command prompt

1. Go to where the Vugen is installed and navigate to the 'bin' folder

C:\Program Files\HP\Virtual User Generator\bin

2. Run the following command there
mmdrv.exe -usr [Full path of the script name.usr]

lr_param_sprintf security issue when run over a firewall(Error: CCI security error: You are running under secure mode and the function lr_param_sprintf is not allowed in this mode. )

The function lr_param_sprintf sometimes causes a security issue in the script when run from Performance Center. 

Error Message 
Error: CCI security error: You are running under secure mode and the function lr_param_sprintf is not allowed in this mode.

This function causes an issue in Performance Center due to the way the function works and the way the Load Generators have been setup in the environment as this function does not work over a firewall.
Solution:This is an example of how function could be to generate a timestamp value – 

lr_param_sprintf( "timeStamp" , "%ld", time(&t) ); 
An easier and workable way of which is

char strTime[10]; //timestamp variable
/*
-- -- -- -- -- -- -- --
Other code goes here
-- -- -- -- -- -- -- --
*/
lr_save_string( (char*)itoa( time(&t), strTime, 10 ), "timeStamp" );

Invoke Vugen from a .net app

1. Add System as a Reference to the project
2. Here is actual code to run the script -
Shell("[Vugen Installation Folder]\bin\mmdrv.exe -usr [Full path of the script] -vugen_win 0", AppWinStyle.NormalFocus)

Example :


Shell("C:\Program Files\HP\Virtual User Generator\bin\mmdrv.exe -usr C:\FlightsTool\FlightCal.usr -vugen_win 0", AppWinStyle.NormalFocus)
Note: Neither Vugen now the Run Time window will be visible as the script runs in the background, however the results, log files, etc will be still be saved in the usual location.

Sample date conversion program using vugen scripting in Load runner

//Main Function
Action()
{
char *ConvDate;

//Call date conversion function
dateConv("10/JUL/2009", ConvDate);
lr_output_message("date is %s",ConvDate);
return 0;
}

//Date conversion function
dateConv(char *MyDate, char *ReqDate)
{
lr_save_var(MyDate,2,0,"Date");
lr_save_var(MyDate+3,3,0,"pMonth");

lr_output_message("Month is %s",lr_eval_string("{pMonth}"));

if(strcmp(lr_eval_string("{pMonth}"),"JAN")==0)
lr_save_string("01","Month");
/*  Similar rest of the code goes here....*/
else if(strcmp(lr_eval_string("{pMonth}"),"DEC")==0)
lr_save_string("12","Month");

lr_save_var(MyDate+7,4,0,"Year");

ReqDate = lr_eval_string("{Month}/{Date}/{Year}");
lr_output_message("date is %s",ReqDate);

return 0;
}

Bugzilla interview questions?

What is Bugzilla?Bugzilla is a bug tracking system developed at mozilla.org.

How do enter a bug in Bugzilla?To enter a bug, through "Enter a new bug" link from the main Bugzilla page. This will take you to a product selection screen.

What happens once enter a bug?After you enter a bug, mail is sent both to you and the QA department. A member of the QA department will verify that they can reproduce your bug.

How do search a bug?To search a bug, through "Query" link from the main Bugzilla page.

How do submit a patch?The new Bugzilla system supports the attachment of patches, test cases, and various other forms of file types directly from the bug report screen. Just click on "Create an attachment"

Are cookies required in Bugzilla?Yes.

How can you view your assigned bugs?We can view the assigned bugs though “My Bugs” link.

How can you generate bug report?We can generate bug report through “Report” link.

When Bugzilla was released?Bugzilla was released in 1998.

Which language was written Bugzilla first time?Bugzilla was originally written in "TCL".

Who developed the Bugzilla?Terry Weissman

Which language Bugzilla written?"Perl"

What are the Bugzilla fields?Bugzilla have 11 fields like-
(1)Product
(2)Component
(3)Version
(4)Platform
(5)OS
(6)Priority
(7)Severity
(8)Assigned To
(9)URL
(10)Summary
(11)Description
How can you edit your account in Bugzilla?We can use "User Preferences" link.

How can you add new Product in Bugzilla?We can use "Product" link for adding new product.

How can you add Components of product in Bugzilla?We can use "Components" link for adding components in Bugzilla.

How can edit version of any product in Bugzilla?We can use "Edit Versions" link

"Memory violation error "in Load Runner

Reasons for this:
  1. C pointer errors,C programming invalid declarations
  2. Memory full
  3. Not enough Memory for what you need to place in a defined space
  4. Memory not yet allocated before attempting to use it
  5. Memory allocated but not deallocated
  6. Trying to copy a non pointer version of a datatype to a pointer defined version of a datatype, such as copying a character array to a pointer to a character array
  7. Generally unless you have a hardware issue this is a developer error

How to verify the Vusers or Monitors that are currently licensed in load runner

How to verify license related information like Expiration dates, monitors purchased, and the number and type of Vusers.

For LoadRunner7.0 – 7.8 Feature Pack1:
a. Bring up the Controller and go to Help - About LoadRunner
b. Click on ‘License Info…’ and you will see the License Information.


For LoadRunner8.0:
a. Go to Start - Programs - LoadRunner - LoadRunner
b. Click on the ‘License’ menu and you will see the ‘Host ID’ on the screen.

How do I add a new License key in load runner?

For LoadRunner7.0 – 7.8 Feature Pack1:1. Bring up the Controller and go to Help - About LoadRunner. 
2. Click on "New License" and type in the new license key. 
3. Click .
4. Close the Controller and restart it; the new license key will be in effect.

For LoadRunner 8.0:1. Close the Controller
2. Go to Start - Programs - LoadRunner - LoadRunner
3. Click on the ‘License’ menu
4. Click on ‘New License’ and type in the new license key
5. Click , and to close the window
6. Bring up the Controller again.

How do I generate a HostID for a LoadRunner license in load runner

For LoadRunner7.0 – 7.8 Feature Pack1:a. Bring up the Controller and go to Help - About LoadRunner
b. Click on ‘License Info…’ and you will see the ‘Host ID’ on the screen.


For LoadRunner8.0:a. Go to Start - Programs - LoadRunner - LoadRunner
b. Click on the ‘License’ menu and you will see the ‘Host ID’ on the screen.

Note: If for some reason you are not able to get to this screen, you can run licidgenerator.exe in \bin directory to generate Host-id

How do I identify the SSL protocols and certificates used by a website when testing with LoadRunner

Cause -Understanding the SSL Protocols and certificates used by a website.
Solution -To identify the type of SSL and certs used on a web server, type the following commands from a Loadrunner client workstation :


  • Go to the Loadrunner/bin directory.
  • Type "openssl", this will then display an >openssl prompt.
  • Type "s_client - connect www.test.com:443" where test.com is your web site.

This will then return details of the web servers SSL configuration.

Other usefull commands to use in LoadRunner Web protocol scripts are as follows:

web_set_sockets_option("SHUTDOWN_MODE", "FAST");Allows the disconnection of the SSL session to be completed quickly.

web_set_sockets_option("SSL_VERSION", "TLS");
web_set_sockets_option("SSL_CIPHER_LIST", "RC4-MD5");
These options allow the version and cipher for SSL to be specified. Possible versions and ciphers are detailed in the Loadrunner Function Reference.

web_set_sockets_option("TRACE_SSL_IO","1");This option will detail all SSL IO in the normal vuser log.

web_set_sockets_option("PRINT_SSL_INFO","1");This option will detail the version and certificate used in the SSL configuration.

web_set_sockets_option("PROXY_INITIAL_BASIC_AUTH","0");This option disables the initial Basic authentication

Error: “License manager does not support objects of this type or license is invalid”

Verify the followings:
Check the properties of the license key. If you apply a license key that has components that does not come with that version of LoadRunner, you will get this error.
Example:Apply WAN emulation license (introduced in LoadRunner 7.6), or J2EE diagnostics (Introduced in LoadRunner 7.8 FP1) license on LoadRunner 7.5
Make sure that you are applying the license key on a machine where the license is generated for. In LoadRunner7.x, license keys are host lock. If you try to apply the license key on a separate machine, you will get this error.

Error: “Cannot install license information, probably access to system resource was denied”

Solution:
This error indicates that you need to log in with local administrator permission, since you installed the product with administrator permission. If you still get the error after login as local administrator, run setlicensepermissions.exe from the \bin directory to change the registry permissions

Error “License key was generated with a version superior to your license manager. Upgrade your license manager”

Solution:
Make sure the HostID that was sent to HP Customer Support was generated from the correct LoadRunner version. If you sent the HostID of LoadRunner 7.6, but apply the license key on LoadRunner7.0 install, you will get this problem.

Error: "License cannot be save in your installation directory. (Error code = -4) It will be used only for this session.

Solution:
Make sure that you have administrator privilege to the Controller. If you are accessing the Controller via the network, make sure that you have write access to the network.

Client Interview Question in Load runner

1) How you will get the requirements?

2) What is the differences between running vuser as a process and thread ?

3) Which functions are used in scripting ?

4) Work flow process of the perormance testing?

5) Have you used in controller ?

6) How you design a scenario in controller ?

7) Have written any functions in scripting ?

8) What are the bottlenecks you found?

9) Have you using goal oriented scenario ?

10) Tell me your project end to end process?

11) Tell me about your experience project profile

12) Your LR rating in 1 to 10 scale

14) What is protocol?

15) What is a memory leak?

16) Define Heap Usage?

17) Your past experience how many users you have run the test?

18) What are the bottlenecks you have find the current project? Tell me two critical bottlenecks

19) What type recommendations given to the client or stakeholder?

20) What protocol you worked in fast experience? How to work with that web service protocol in your project.

21) You have any use the heart beat settings did you used in current project?

22) How work is handled in the team?

24) You have 10 URLs? How to test the URLs in in at a time LR (i am not understand the Question)

26) You have any used the custom functions in your project?

28) When memory reach 100%, then ideally what you will think?

30) What type of reports and documents you have prepared? Explain the summary report.

32) Tell me the LR server requirements?

34) What type of analysis did you used in your projects? Tell me few observations and what parameter u have captured?

36) What you have done the Pervious projects? Explain the last project

38) What are other options in correlation function and did u used in your project?

Copying files larger than 2 GB over a Remote Desktop Services

When you try to copy a file that is larger than 2 GB over a Remote Desktop Services or a Terminal Services session through Clipboard Redirection (copy and paste) by using the RDP client 6.0 or a later version, the file is not copied. And, you do not receive an error message.


There are two methods for this

Method 1:Use Drive Redirection through Remote Desktop Services or a Terminal Services session if you want to transfer files larger than 2 GB.

Method 2:
Use command-line alternatives such as XCopy to copy files larger than 2 GB over a Remote Desktop Services or Terminal Services session. For example, you can use the following command:

xcopy \\tsclient\c\myfiles\LargeFile d:\temp
Copy and paste files:
You can copy and paste the files between the remote session and the local computer or between the local computer and the remote session by using the Copy and Paste feature. However, this is limited to files that are smaller than 2 GB.

Transfer of files by using Drive Redirection:
The drives on the local computer can be redirected in the session so that files can easily be transferred between the local host and the remote computer. The drives that you can use in this manner include the following:
  1. local hard disks
  2. floppy disk drives
  3. mapped network drives
On the Local Resources tab of Remote Desktop Connection, users can specify which kinds of devices and resources that they want to redirect to the remote computer.

Do You Know If Your Database Is Slow?

The time to respond:

There was a question at Pythian a while ago on how to monitor Oracle database instance performanceand alert if there is significant degradation. That got me thinking, while there are different approaches that different DBAs would take to interactively measure current instance performance, here we would need something simple. It would need to give a decisive answer and be able to say that “current performance is not acceptable” or “current performance is within normal (expected) limits”.

Going to the basics of how database performance can be described, we can simply say that database performance is either the response time of the operations the end-user do and/or the amount of work the database instance does in a certain time period – throughput.

We can easily find these metrics in from the v$sysmetric dynamic view:

SQL> select to_char(begin_time,'hh24:mi') time, round( value * 10, 2) "Response Time (ms)"
from v$sysmetric
where metric_name='SQL Service Response Time
'

TIME Response Time (ms)
--------------- ------------------
07:20 .32


So this is the last-minute response time for user calls (here in ms). We can check the throughput by checking the amount of logical blocks (it includes the physical blocks) being read, plus we can add direct reads (last minute and last several seconds output here for a database with 8 KB block):

SQL> select a.begin_time, a.end_time, round(((a.value + b.value)/131072),2) "GB per sec"

from v$sysmetric a, v$sysmetric b

where a.metric_name = 'Logical Reads Per Sec'

and b.metric_name = 'Physical Reads Direct Per Sec'

and a.begin_time = b.begin_time


BEGIN_TIME END_TIME GB per sec

-------------------- -------------------- ----------

16-jun-2013 08:51:36 16-jun-2013 08:52:37 .01

16-jun-2013 08:52:22 16-jun-2013 08:52:37 .01


We can check more historical values through v$sysmetric_summary, v$sysmetric_history and dba_hist_ssysmetric_summary.

So did these queries answer the basic question “Do we have bad performance?”? 100 MB/sec throughput and 0.32 ms for a user call? We have seen better performance, but is it bad enough that we should alert the on-call DBA to investigate in more detail and look for the reason why we are seeing this kind of values? We cannot say. We need something to compare these values to so that we can determine if they are too low or too high. It is somewhat like being in a train that passes next to another moving train, going in same direction but at a different speed. We don’t know the speed of our train, and we don’t know the speed of the other train, so we cannot answer the question “Are we going very fast?”. If we turn to the other side and see a tree passing on the other side of the train, we will be able to estimate the speed of the train (also taking into account our experience of what is very fast for a train…). So we need something that has an absolute value. In the case of the tree, we know that the tree has speed of 0

How to Improve Database Performance by Measuring User Experience?

What is Response Time Analysis?

Response time analysis is a new approach to application and database performance improvement that allows DBAs and developers to manage their databases guided by the most important criteria - what causes application end-users to wait. Also referred to as wait time analysis, it allows IT teams to align their efforts with service level delivery for IT customers.

The picture represents the Response Time monitoring process. Each SQL query request passes through the database instance. By measuring the time at each step, the total Response Time can be analyzed.


Rather than watching server health statistics and making guesses about their performance impact, wait and response time methods measure the time taken to complete a desired operation. The best implementations break down the time into discrete and individually measurable steps, and identify exactly which steps in which operations cause application delays. Since the database primary mission is to respond with a result, response time is the most important criteria in making database performance decisions.

Response Time = Processing Time + Waiting Time

Response time is defined as the sum of actual processing time and the time as session spends waiting on availability of resources such as a lock, log file or hundreds of other Wait Events or Wait Types. Even when the session has access to the CPU (a CPU Wait Type for example), it is not necessarily being actively processed, since often the CPU is waiting for an I/O or other operation to complete before processing can continue. When multiple sessions compete for the same processing resources, the wait time becomes the most significant component of the actual Response Time.

Wait Events and Wait Types
To accurately measure the Response Time for a database, it is necessary to discretely identify the steps accumulating time. The steps corresponding to physical I/O operations, manipulating buffers, waiting on locks, and all other minute database processes are instrumented by the database vendors. In SQL Server, these steps are called Wait Types. In Oracle, Sybase and DB2, they are referred to as Wait Events. While the specifics are unique for each vendor, the general idea is the same. These Wait Types/Events indicate the amount of time spent while sessions wait for each database resource. If the Wait Types/Events can be accurately monitored and analyzed, the exact bottlenecks and queries causing the delays can be determined.

Differences vs. Conventional Statistics
Typical database performance monitoring tools focus on server health measures and execution ratios. Even with a sophisticated presentation these statistics do not reflect the end-user experience or reveal where the problem originated. Knowing an operation took place millions of times does not inform whether it was actually the cause of an application delay.

Key criteria to distinguish Response Time vs. Conventional analysis methods:

Measure response time for an action to take place, from receipt of request to beginning of response.
Measure each SQL query separately, so the response time effects of a specific SQL can be isolated and evaluated. Measuring total response time across the instance does not give useful information.
Identify the discrete internal steps (Wait Types/Events) that a SQL query takes as it is processed. Treating the instance as a black-box without seeing where the time is consumed internally does not help problem solving.
Practical Considerations for Response Time Analysis
The Response Time approach to performance monitoring is only practical if it can be implemented efficiently in a performance sensitive production environment. Confio uses low-impact agentless technology to meet this requirement. Here are some practical considerations:

  • Low Impact Data CaptureData capturing should not place a burden on your production systems. 
  • Agentless architectures offload processing to a separate system that reduces production database impact to less than 1%.Agentless Database OperationEliminate need to test, install and maintain software on production servers.
  • Passive Monitoring of Production DataMonitor real production sessions, not simulated test transactions.
  • Continuous 7/24 MonitoringInsist on continuous monitoring across all sessions on all servers to ensure any operation can be deeply examined at any time. Occasional trace files will not provide continuous coverage.

How does collating the test results work in loadrunner controller?

At the end of a test the results are collated by the LoadRunner controller. Each of the generators results are collected in a .eve (Event) file and the output messages for the controller are collected in a .mdb (Microsot Access) database. This happens in the directory specified for the results on the controller. A .lrr (loadrunner
results) file is created. The .lrr file is text. The .eve file was text prior to around LoadRunner 7.5, but since then it has been an unpublished compressed format. 

When you start the analysis utility it take the information in the .lrr file and the .eve file and creates a .mdb (microsoft access database) or SQL Server database entries which contain each timing record and data
point entries. If collation fails at the end of the test you will have only partial results for analysis

How we will do Spike Testing and Explain it with example?

Spike Testing is a form of testing process in which an application is tested with unusual increment and decrements in the load. The system is unexpectedly loaded and unloaded. It is done to notice how actually the system reacts with unexpected rise and decline of users.

Example:

when you are always checking the result of your exam on JNTU site means site is suddenly loaded and unloaded and then the IT squad of JNTU check how the site reacts with unexpected increase and decrease of users than it is Spike testing.

Spike testing is mechanism of testing which means when in a web page frequent number of visitor access the page unexpectedly increases to maximum then obviously performance of the page breaks down. So the mechanism of testing a performance about web page due to unexpected sort of traffic on the page is always called as Spike testing.

Spike testing is usually done by unexpectedly increasing the number of loads generated by users by a very enormous amount and observing the dramatic behavior of the system.

The goal of spike testing is to regulate whether performance will deteriorate, the system will always fail, or it will be able to hold dramatic changes in load.

A spike is a keen rise in the density for a given variable, generally immediately followed by a decrease. This category of transient variation is often notice in the measurement of voltage or you can say current in circuits.

Spike testing is always used in load and performance testing. These tests are commonly based on real universe or projected workloads with focus on huge load/performance conditions.Spike testing is handling to check whether a system can handle dramatic changes in load. It is accomplish by spiking the no of users of an application and always produces an excellent way of verifying existing limitations in the current operational environment. spike testing is a type of performance testing

Issues when creating Loadrunner scripts with the Java protocol

When writing a Loadrunner script that interacts with MQ, Websphere or Weblogic, as a scripter, you need to use the Java protocol.

This is a bit of a nuisance for those of us who have become familiar with C programming language and can use it with our eyes shut. The question is often asked, why do I need to use Java? I want to use C. Java can take a long time to use and logically seems to work quite differently to C.

Well, the answer is a little obvious (but only when you know the answer!) In order to develop Automation for MQ, Weblogic or Websphere, you often need to use the same libraries that the developers have used. The developers have often written the application in Java, and the supporting object libraries are the Java versions for the middleware products MQ, Weblogic and Websphere.

In many cases, the Loadrunner automation is simulating a device which runs the Java application. This could be a desktop, laptop or a handheld terminal (HHT). The device contains a compiled version of the code. This code is executed on one of three circumstances:

• The device is switched on and the operating system is configured to execute at start up
• An input is received from the device such as barcode being scanned
• A message is received from a middleware application such as MQ, Websphere or Weblogic

When executing an automated test script with Vugen, Loadrunner always compiles the script first. With a Java script, this will create a compiled version of the application similar to that which in the real world is located on the desktop, laptop or a handheld terminal. The main difference between the Loadrunner script and the real application is that the Loadrunner script would normally be written to process a distinct business function, i.e. it would contain only a subset of the functionality of the real application.

In order to compile the application, the Loadrunner scripter needs to have access to the same common java files as the developer, the so called JAR files. The JAR files need to be accessible to Loadrunner when it compiles. This is done by entering the information into the runtime settings. By specifying the location of the classpath files in the runtime settings, you are telling Loadrunner where to find the Classpath files so that compilation will work.

While this seems straightforward, the way Loadrunner works with the compiler means that it detects the names of the Classpath files, but does not necessarily determine where they are.

To get around this we can change the path statement on the environment variables for the machine running Vugen. This also does not always work. What should work is to physically place the JAR files in the Loadrunner directory of program files and set the Classpath statements accordingly.

At this point your script will compile and any other errors after this are down to real coding issues

Difference Between Verification And Validation Explain It With Example?

Verification and Validation example is also given just below to this table. 

             Verification
             Validation
1. Verification is a static practice of verifying documents, design, code and program.
1. Validation is a dynamic mechanism of validating and testing the actual product.
2. It does not involve executing the code.
2. It always involves executing the code.
3. It is human based checking of documents and files.
3. It is computer based execution of program.
4. Verification uses methods like inspections, reviews, walkthroughs, and Desk-checking etc.
4. Validation uses methods like black box (functional)  testing, gray box testing, and white box (structural) testing etc.
5. Verification is to check whether the software conforms to specifications.
5. Validation is to check whether software meets the customer expectations and requirements.
6. It can catch errors that validation cannot catch. It is low level exercise.
6. It can catch errors that verification cannot catch. It is High Level Exercise.
7. Target is requirements specification,application and software architecture, high level, complete design, and database design etc.
7. Target is actual product-a unit, a module, a bent of integrated modules, and effective final product.
8. Verification is done by QA team to ensure that the software is as per the specifications in the SRS document.
8. Validation is carried out with the involvement of testing team.
9. It generally comes first-done before validation.
9. It generally follows after verification.

Example of verification and validation are explained below:
Suppose we have the specifications related to the project than by checking that specifications without executing to see whether the specifications are upto the mark or not is what we have done in verification.

Similarly Validation of the software is done to make sure that the software always meets the requirements of the customer by executing the specifications of the project and product.

Note that the customer and end users are concerned in validation of the software.

It is also crucial to differentiate between end users, and customers. Considering example, if you are developing a library monitoring system, the librarian is the client and the person who issue the books, collect fines etc. are comes under the category of the end users.

Techniques or Methods of Verification and Validation


Methods of Verification

1. Walkthrough
2. Inspection
3. Review
Methods of Validation
1. Testing
2. End Users

1) Verification and Validation both are necessary and complementary.
2) Both of them provides its own sets of Error Filters.
3) Each of them has its own way of detect out the errors left in the software.

Lots of people use verification and validation interchangeably but both have different meanings.

Verification process describes whether the outputs are according to inputs or not, and Validation process describes whether the software is accepted by the user or not.