tnsnames.ora file unable to edit or access denied error-Solved

The tnsnames.ora file is where the Oracle Client stores database connection entries. These entries contain information that allows the ODBC driver to establish network connections to an Oracle Database, including hostname and port number. Users must create an entry in this file for each database they wish to access. The syntax for connection entries is strictly defined, so it's important to make sure they are formatted correctly.

The sqlnames.ora file is where the Oracle Client stores various network connection settings which apply to ODBC connections. Like tnsnames.ora, entries in the file follow a rigid format. In order to connect to EPM, users must add lines permitting an encrypted connection.

Copies of the tnsnames and sqlnet entries used to connect to the EPM database are included in the initial authorization email EPM users receive.
Here i am showing the solution to resolve the access denied error when user wants to update it.

Follow these steps:

1.Begin by clicking on Start and go to All Programs go to Accessories-select Note pad
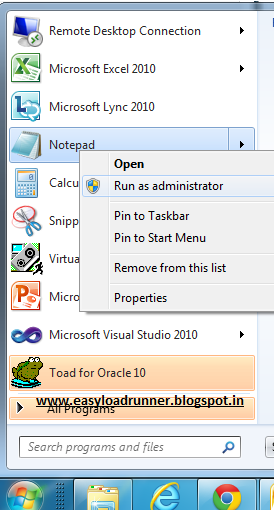


2.Right-click on Notepad and select Run as administrator button.In Notepad, click on File and goto Open. Switch the dropdown menu in the lower right hand corner of the screen from Text Documents (*.txt) to All Files.Then you are able to see the location of your tnsnames.ora file.

Locate the folder where you installed the Oracle Client (ORACLE_HOME). If you used the document EPM - Downloading and Installing Oracle 11g Client and ODBC Driver for Windows to install the Client, this folder should be named C:\Oracle32 or C:\Oracle64 depending on the version of the software you chose to install. 

3.Open the below location in your machine:

Go to  C(Windows) drive-app-Oracle-Product_11.2.0-Client_1-network


If files named tnsnames.ora or sqlnet.ora already exist in the folder, open them. Before making any changes to the files, click File goto Save As..and save them as tnsnames.ora.old and sqlnet.ora.old (be sure to switch the Save as Type: dropdown box to read All Files before saving). In doing this, you are creating backups of the original files in case you need to revert to the older versions at some point. If neither of these files already exists, hit Cancel to return to the Notepad editor.

Copy and paste the tnsnames connection entry you received  into the Notepad document. If you are editing an existing tnsnames.ora file, append the entry to the end of the file. Click File goto Save As... and save the file as tnsnames.ora. If you are prompted to replace the existing file,then click the button 'Yes'.

Copy and paste the sqlnet connection entry you received  email into the Notepad document. If you are editing an existing sqlnet.ora file, append the entry to the end of the file. Click File goto Save As... and save the file as sqlnet.ora. If you are prompted to replace the existing file, click 'Yes'.

4.To test your the ODBC connection, open a command prompt (Click Start, type 'cmd' in the search bar, and hit Enter). At the command prompt, enter the following command: 'tnsping connection_name'. For example, if you wish to test the connection to the EPQAS test database, type 'tnsping epqas'. 

You will get the output as:


IIS SERVER (Internet Information Server)

IIS (Internet Information Server) is a group of Internet servers (including a Web or Hypertext Transfer Protocol server and a File Transfer Protocol server) with additional capabilities for Microsoft's Windows NT and Windows 2000 Server operating systems. IIS is Microsoft's entry to compete in the Internet server market that is also addressed by Apache, Sun Microsystems, O'Reilly, and others. With IIS, Microsoft includes a set of programs for building and administering Web sites, a search engine, and support for writing Web-based applications that access databases. Microsoft points out that IIS is tightly integrated with the Windows NT and 2000 Servers in a number of ways, resulting in faster Web page serving.

A typical company that buys IIS can create pages for Web sites using Microsoft's Front Page product (with its WYSIWYG user interface). Web developers can use Microsoft's Active Server Page(ASP)technology, which means that applications - including ActiveX controls - can be imbedded in Web pages that modify the content sent back to users. Developers can also write programs that filter requests and get the correct Web pages for different users by using Microsoft's Internet Server Application Program Interface (ISAPI) interface. ASPs and ISAPI programs run more efficiently than common gateway interface (CGI) and server-side include (SSI) programs, two current technologies. (However, there are comparable interfaces on other platforms.)

Microsoft includes special capabilities for server administrators designed to appeal to Internet service providers (ISPs). It includes a single window (or "console") from which all services and users can be administered. It's designed to be easy to add components as snap-ins that you didn't initially install. The administrative windows can be customized for access by individual customers

Using ANTS Memory Profiler to track down a memory leak in a WinForms application

Source: http:www.red-gate.com/products

Using ANTS Memory Profiler to track down a memory leak in a WinForms application
This walkthrough shows how to locate a memory leak using a sample application called QueryBee. QueryBee is a simple WinForms application for running queries against SQL Server databases. It has a database connection dialog and a query window to query the database. We know our application is leaking memory, because every time we open a query window and close it again, our memory usage increases.

When you open the profiler, you first see the Startup screen:


Figure 1. The ANTS Memory Profiler startup screen.

Here, there’s a list of your recent profiling sessions so you can re-run them easily. For this example, we’ll start a new session by clicking New profiling session.

The New profiling session screen is displayed:


Figure 2. It's easy to configure and start a new profiling session.

All we need to do is point it at QueryBee, choose our performance counters, and click Start profiling.

The profiler starts up QueryBee and begins collecting performance counter data:


Figure 3. Whilst profiling, ANTS Memory Profiler collects performance counter data. The profiler is telling us that it's profiling our application. There are also some useful instructions on this screen telling us to take and compare snapshots.

Taking and comparing memory snapshots is a key activity when looking for memory leaks, so our approach will be as follows:
Wait for QueryBee to open.
Take a first snapshot without using the application; this first snapshot will be used as a baseline.
Within QueryBee, perform the actions that we think cause the memory leak.
Take a second snapshot.
Examine the comparison that the profiler shows us after it has finished taking and analyzing the second snapshot.

So, QueryBee is open, sitting in our system tray.

At this point, we take a first snapshot, which we will use as a baseline for comparison with later snapshots.

When we click the Take Memory Snapshot button, the memory profiler forces a full garbage collection and takes a snapshot of the heap memory it is using.


Figure 4. Results from our first snapshot – Summary screen.

Now, we go back to QueryBee and perform the tasks which we think cause the memory leak.

We open up QueryBee and connect to a database.


Figure 5. QueryBee – Database connection dialog.


Figure 6. QueryBee – The query window.

The query window opens up and we enter and execute a SQL query.

We obtain some results and close the query window.


Figure 7. QueryBee – The results are displayed in a grid.

We close the query form.

At this point, the window is gone. We expect the memory usage to fall back to where it was in the first snapshot, but that is not the case.


Figure 8. Despite closing our query window, the memory usage has not fallen.

So what's happening here? We take a second snapshot and get the results.


Figure 9. The summary pane compares the results of the two snapshots.

A number of problems are highlighted by the summary screen.
We can see a large memory increase between snapshots, which we noticed on the timeline (top left).
The Large Object Heap appears to be fragmented, which could cause problems (top right).
The Generation 2 heap accounts for a large proportion of memory usage - often indicating objects are being held onto for longer than necessary (bottom left).

We can choose to select one of the largest classes which are shown to us in the bottom right of the screen, but instead we switch to the class list to find out more. The class list gives us a fuller picture of what's in the snapshot.

We're interested in objects which have been created since the baseline snapshot, so we need to look at types which have more instances in the second snapshot. We therefore sort by Instance Diff in decreasing order.


Figure 10. The class list allows you to compare memory usage in both snapshots in more detail.

The String class has been placed at the top of the list, with over 300,000 new instances. We want to understand why there is such a large increase so load the Instance Categorizer for the String class by clicking the  icon.


Figure 11. The Instance Categorizer shows chains of instances sorted by their shortest path to GC Root.

We see that over 21MB of the String class are held in memory by the same shortest path back to GC Root, via our QueryForm and ConnectForm. We select Show the Instances on this Path to view a list of every instance in the previous category.


Figure 12. The instance list view shows us a set of strings which we recognize as coming from our SQL Database.

The Instance List is showing us data which QueryBee had retrieved from the SQL Database, but that data should have been destroyed when QueryForm was closed. We select one of the instances and click the  icon to generate an Instance Retention Graph.


Figure 13. This instance retention graph.

Using the instance retention graph, we should be able to find out what is still referencing our String instances. Then, we'll be able to go back into our code to break the chain of references that is keeping them in memory.

We start at the bottom and work our way up the graph until we find a reference that needs to be broken. We'll just need to break the chain at one point to allow the garbage collector to clean up everything below that.

By navigating up, we can see the string is being held onto by QueryForm, even though that should have been released from memory. Looking a little further up, the graph is telling us that a System.EventHandler is referencing QueryForm and, if we step up one more level, it's telling us that the event handler is referenced by our ConnectForm instance – this is the form that asked us for the database connection details. In other words, the ConnectForm is holding onto the QueryForm via an Event Handler.

If we look at this node more closely, we see that it's actually being referenced by the ConnectForm's Foregrounded field.

Let's find this Foregrounded event in our code. We right-click on the QueryBee.ConnectForm node and open the ConnectFormsource code in Visual Studio™.


Figure 14. Foregrounded event in the ConnectForm source code.

The profiler automatically jumps to the Foregrounded event. We check where it is being used by right-clicking on Find All References.


Figure 15. The Foregrounded event is used in three places.

We've got three usages and we find that the last usage is where QueryForm registers for the Foregrounded event, but it doesn't look like it unregisters. If we fix that, then the memory leak should go away.

Once we're done, we need to rebuild, but first we need to stop profiling QueryBee so that the executable isn't locked. We go back to Profiler and click on the Stop Profiling button.

Then, we rebuild.


Figure 16. We rebuild our QueryBee application.

Back in the profiler, we start up a new profiling session. We want to find out whether the reference to the QueryForm has disappeared.

Note that it remembered our settings from last time, so all we need to do is click Start Profiling.


Figure 17. The settings dialog remembers settings from last time.

We take a first snapshot to use as a baseline.

We perform the same actions as last time: take a baseline snapshot while QueryBee is idle, then a snapshot once we’ve connected and run a query.

We'll also take an extra snapshot, because we want to be able to verify that the QueryForm has disappeared.

Finally, we close the query window with the results grid and we take a third snapshot.

We switch to a comparison between snapshots 1 and 3, using the snapshot selection field just under the timeline.


Figure 18. Summary screen comparing snapshots 1 and 3.

We can see there is now only a small memory increase between the snapshots, which is promising. Let's see if there's a QueryForm still in the class list.

We switch to the class list view and search only for classes in the QueryBee namespace.


Figure 19. Class list for the QueryBee namespace.

No, it's gone. We're no longer leaking the form

ANTS Performance Profiler Tool

Source: http://www.red-gate.com/products

It is a Profile and boost the performance of your .NET applications

ANTS Performance Profiler is an application profiler for .NET desktop, ASP.NET, and ASP.NET MVC applications:
Find performance bottlenecks fast by profiling both the .NET code and the data access layer
Get rich performance data, right-down to line-level timings and expensive database queries
Save time going round in circles diagnosing and debugging – let the profiler do the hard work for you
Explore unfamiliar code bases
NEW! Enhanced data access profiling: added support for profiling MySQL (or MariaDB) and PostgreSQL, so you can see queries run against those databases too

Drill down to slow lines of code with line-level timings
Profile C# or any other .NET code line by line, with precise timing data so you can find issues at a glance. Expensive lines of code are automatically highlighted for quick visual inspection.

Jump straight to the slowest activity
The call tree shows performance data for every method and identifies the most expensive methods, database queries, and web requests.

Capture outgoing web requests *
Look at your application's outgoing http requests. Get data about the request and response headers, and see what .NET code caused them to run.

Look at your code's database interaction *
Understand how your .NET code makes database queries and how those queries perform. ANTS Performance Profiler supports SQL Server and Oracle databases, whether local or remote.

Immediate feedback on application performance
Use the interactive timeline to check the CPU usage of your .NET or ASP.NET application and highlight problem areas to focus only on the data that matters.
Group methods by HTTP request *

Code and database activity are grouped by HTTP request, exposing performance problems on specific web pages.

Profile async code
Understand the performance of C#5 async code. View activity in the context of the code you wrote, and see how work being done asynchronously is related to the async method which caused it to run.

Decompile third-party code *
Find bottlenecks in 3rd party components and framework assemblies using integrated decompilation, powered by .NET Reflector.

.NET developers use ANTS Memory Profiler to:Find memory leaks within minutes
Optimize the memory usage of your C# and VB.NET code
Profile your code's use of unmanaged memory
Create better performing, less resource-intensive applications
Available as a standalone tool or as part of our .NET Developer Bundle
Why ANTS Memory Profiler?


Automatic memory management in .NET makes development a lot easier, but it's still easy to introduce memory leaks into your application. For example, forgetting to unregister event handlers can lead to significant chunks of memory being held on to unnecessarily, but spotting that this is happening can be very difficult.

Trying to understand memory problems without a suitable tool can take hours or days, if you're lucky enough to know a problem exists. This is time which would be better spent fixing the problem.

A tool every .NET developer should use
ANTS Memory Profiler makes memory profiling simple. With it, you can:
Obtain clear, meaningful results, making it easier for you to interpret the information. Spend your time fixing problems instead of struggling to understand them.
Get results fast – with a footprint of less than 32 MB, the profiler can comfortably profile large, complex applications, with virtually no overhead. Take as many snapshots of the heap memory as you like, in seconds rather than minutes.
Quickly visualize the relationship between your objects – use the instance retention graph to quickly see why your leaking objects are still being held in memory. You don't have to build a mental map to keep track of how objects reference each other.
Go straight to the source of the problem - intelligent analysis highlights the most likely causes of issues, often saving hours of problem-hunting.
Zero in fast on the causes of memory leaks – powerful filtering options allow you to cut through the noise, enabling you to quickly get to the root of even the most complex problems.

Disk cleanup in windows server 2003 (From command line)

In some times our system may go down due to the unnecessary files or recycled files or setup files or compressed zip files on our system.

In windows 2003 server we do not have an option  to clean the disk same as windows 7

In Windows Server 2003:

1.Go to Start 
2.Type RUN ,click on RUN icon
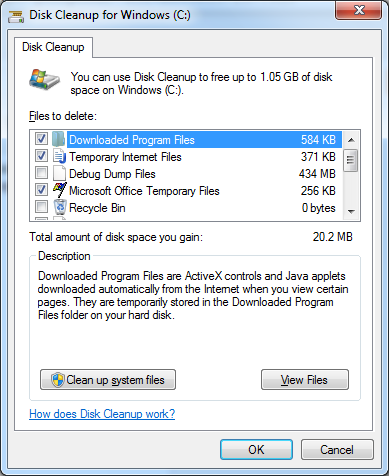
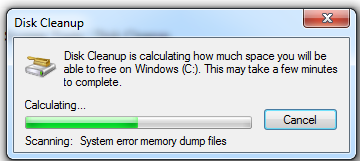
3.Enter cleanmgr at the command line then it will display the below screen


Check the boxes which are to be deleted,then click on OK.


In Windows 7:

1.Go to Start -All Programs - Accessories - System Tools - Disk Cleanu
p

Perfmon to capture the Process Performance of server or system

 How do we track and log system and process information on a Windows operating system?

 Windows system tools available for monitoring almost every type of performance, including CPU, memory, file system and network usage. You do not have to rely merely on the Task Manager.

There is a Windows utility called PerfMon (Performance Monitor) that has the ability to graph and log performance metrics for specific processes, as well as set alarms and timing for performance monitoring and logging.

Steps to View and Log Performance Data Using Windows 7 Performance Monitor:

1.Make sure LabVIEW is open.

2.Click on the Start Menu and click Run.
3.Type perfmon into the Run command prompt and click OK.


4.You will then see the Performance Monitor pop up.


5.Click on the green ‘+’ sign near the top of the Performance Monitor Window to bring up theAdd Counters window.

6.On the left side,choose which counters to add and click Add >>. Your counters should now appear under Added Counters. Click OK.


There are many options for what counters to add. A few that may be of special note when dealing with LabVIEW performance issues are:
Memory
Processor
Process (shown above): Under process, one can choose specific programs to monitor. In the upper left Window, you can select the aspects of the process that you’d like to monitor such as % Processor Time or Virtual Bytes. In the lower left hand window, you can select which process you’d like to monitor. Above, LabVIEW has been selected.

Now you should be able to see all chosen counters updating on the graph

In order to log this data to file, right-click on Performance Monitor and select New»Data Collector Set.


Type in a name for your data set and press Next.


Complete the rest of the steps including choosing the location you want to save your log file.
When you want to start logging the performance data, right-click on your Data Collector Set and select Start. To stop logging, right-click and select Stop.


Note: PerfMon provides ActiveX properties and methods, allowing you to control it through another ADE and even use it as an embedded control in an application.

Bugzilla-A Bug tracking tool

What is Bugzilla?
Bugzilla is a bug tracking system developed at mozilla.org.

How do enter a bug in Bugzilla?
To enter a bug, through "Enter a new bug" link from the main Bugzilla page. This will take you to a product selection screen.

What happens once enter a bug?
After you enter a bug, mail is sent both to you and the QA department. A member of the QA department will verify that they can reproduce your bug.

How do search a bug?
To search a bug, through "Query" link from the main Bugzilla page.

How do submit a patch?
The new Bugzilla system supports the attachment of patches, test cases, and various other forms of file types directly from the bug report screen. Just click on "Create an attachment"

Are cookies required in Bugzilla?
Yes.

How can you view your assigned bugs?
We can view the assigned bugs though “My Bugs” link.

How can you generate bug report?
We can generate bug report through “Report” link.

When Bugzilla was released?
Bugzilla was released in 1998.

Which language was written Bugzilla first time?
Bugzilla was originally written in "TCL".

Who developed the Bugzilla?
Terry Weissman

Which language Bugzilla written?
"Perl"

What are the Bugzilla fields?
Bugzilla have 11 fields like-
  1. Product
  2. Component
  3. Version
  4. Platform
  5. OS
  6. Priority
  7. Severity
  8. Assigned To
  9. URL
  10. Summary
  11. Description

How can you edit your account in Bugzilla?
We can use "User Preferences" link.

How can you add new Product in Bugzilla?
We can use "Product" link for adding new product.

How can you add Components of product in Bugzilla?
We can use "Components" link for adding components in Bugzilla.

How can edit version of any product in Bugzilla?
We can use "Edit Versions" link.

SCOM (System Center Operations Manager) Monitoring tool

System Center Operations Manager 2012 – the complete application monitoring solution

For many years Operations Manager has delivered infrastructure monitoring, providing a strong foundation on which we can build to deliver application performance monitoring. It is important to understand that in order to provide the application level performance monitoring, we must first have a solid infrastructure monitoring solution in place. After all, if an application is having a performance issue, we must first establish if the issue is due to an underlying platform problem, or within the application itself.

A key value that Operations Manager 2012 delivers is a solution that uses the same tools to monitor with visibility across infrastructure AND applications.

To deliver application performance monitoring, we provide 4 key capabilities in Operations Manager 2012:
Infrastructure monitoring – network, hardware and operating system
Server-side application monitoring – monitoring the actual code that is executed and delivered by the application
Client-side application monitoring – end-user experiences related to page load times, server and network latency, and client-side scripting exceptions
Synthetic transaction – pre-recorded testing paths through the application that highlight availability, response times, and unexpected responses

Configuring application performance monitoring

So it must be hard to configure all this right? Lots of things to know, application domain knowledge, settings, configurations? Rest assured, this is not the case! We make it incredibly easy to enable application performance monitoring!

1. Define the application to monitor.


2. Configure server-side monitoring to be enabled and set your performance thresholds


3. Configure client-side monitoring to be enabled and set your performance thresholds


And that’s it, you’re now set to go. Of course setting the threshold levels is the most important part of this, and that is the one thing we can’t do for you… you know your application and what the acceptable performance level is.
Configuring an application performance dashboard in 4 steps

It’s great that we make the configuration of application performance monitoring so easy, but making that information available in a concise, impactful manner is just as important.

We have worked hard to make the creation of dashboards incredibly easy, with a wizard driven experience. You can create an application level dashboard in just 4 steps:

1. Choose where to store the dashboard


2. Choose your layout structure. There are many different layouts available.


3. Specify which information you want to be part of your dashboard.


4. Choose who has access to the dashboard. As you will see a little later in this article, publishing information through web and SharePoint portals is very easy.


And just like that, you’ve created and published an application performance monitoring dashboard!


Anyone who has either worked in IT, or been the owner of an application knows the conversations and finger pointing that can go on when users complain about poor performance. Is it the hardware, the platform, a code issue or a network problem?

This is where the complete solution from Operations Manager 2012 really provides an incredible solution. It’s great that an application and associated resources are highly available, but availability does not equal performance. Indeed, an application can be highly available (the ‘5 nines’) but performing below required performance thresholds.

The diagram below shows an application dashboard that I created using the 4 steps above for a sample application. You can see that the application is available and ‘green’ across the board. But the end users are having performance issues. This is highlighted by the client side alerts about performance.


Deep Insight into application performance

Once you know that there is an issue, Operations Manager 2012 provides the ability to drill into the alert down to the code level to see exactly what is going on and where the issue is.


Reporting and trending analysis

An important aspect of application performance monitoring is to be able to see how your applications are performing over time, and to be able to quickly gain visibility into common issues and problematic components of the application.

In the report shown below, you can see that we can quickly see areas of the application we need to focus on, and also understand how these components are related to other parts of the application, and may be causing flow-on effects.


Easily make information available
With Operations Manager 2012, we have made it very easy to delegate and publish information across multiple content access solutions. Operations staff have access to the Operations Manager console, and we can now easily publish delegated information to the Silverlight based Operations web console and also to SharePoint webparts