Oracle NCA Protocol Example Scripts

In the following example, the user selected an item from a list (nca_list_activate_item), pressed a button (nca_button_press), retrieved a list value (nca_lov_retrieve_items), and performed a click in an edit field (nca_edit_click). The logical names of the objects are the parameters of these functions.

nca_lov_select_item("Responsibilities","General Ledger, Vision Operations");
nca_list_activate_item("FNDSCSGN.NAVIGATOR.LIST.0","+ Journals"); 
nca_list_activate_item("FNDSCSGN.NAVIGATOR.LIST.0"," Enter"); 
nca_button_press("GLXJEENT.TOOLBAR.LIST.0"); 
nca_lov_find_value("Batches",""); 
nca_lov_retrieve_items("Batches",1,9); 
nca_lov_select_item("Batches","AR 1020 Receivables 2537: A 1020"); 
nca_edit_click("GLXJEENT.FOLDER_QF.BATCH_NAME.0");

In certain tests, such as those performed on Oracle Configurator applications, information returned by one function is required throughout the session. VuGen automatically saves the dynamic information to a parameter by inserting a web_reg_save_param function into the script.
In the following example, the connection information is saved to a parameter called NCAJServSessionID. The right boundary is \r. The actual right boundary may differ between systems.
web_reg_save_param ("NCAJServSessionId", "LB=\r\n\r\n", "RB=\r",
       LAST);
web_url("f60servlet",         
         "URL=http://usscifforms05.sfb.na/servlet/f60servlet\?config=mult",
         LAST);

Oracle NCA Protocol Example Scripts


In the following example, the user selected an item from a list (nca_list_activate_item), pressed a button (nca_button_press), retrieved a list value (nca_lov_retrieve_items), and performed a click in an edit field (nca_edit_click). The logical names of the objects are the parameters of these functions.
... 
nca_lov_select_item("Responsibilities","General Ledger, Vision Operations");
nca_list_activate_item("FNDSCSGN.NAVIGATOR.LIST.0","+ Journals");
nca_list_activate_item("FNDSCSGN.NAVIGATOR.LIST.0","       Enter");
nca_button_press("GLXJEENT.TOOLBAR.LIST.0");
nca_lov_find_value("Batches","");
nca_lov_retrieve_items("Batches",1,9);
nca_lov_select_item("Batches","AR 1020 Receivables 2537: A 1020");
nca_edit_click("GLXJEENT.FOLDER_QF.BATCH_NAME.0");
...
In certain tests, such as those performed on Oracle Configurator applications, information returned by one function is required throughout the session. VuGen automatically saves the dynamic information to a parameter, by inserting a web_reg_save_param function into the script. In the following example, the connection information is saved to a parameter called NCAJServSessionID.
web_reg_save_param ("NCAJServSessionId", "LB=\r\n\r\n", "RB=\r",
       LAST);
web_url("f60servlet",         
         "URL=http://usscifforms05.sfb.na/servlet/f60servlet\?config
         =mult",         LAST);
In the above example, the right boundary is \r. The actual right boundary may differ between systems.

Loadrunner And Oracle Part1

Introduction

This is part 1 of an article which discusses some of the mechanisms for performance testing Oracle Applications / Oracle Forms using LoadRunner. This is far from an in-depth article but will, we hope, help performance testers get started with testing Oracle Applications and act as a reference resource. The article as a whole covers two key areas that seem to present the most issues, Object Names and Connect issues, as well as some other issues that we at Testing Performance have come across when delivering our Performance Testing Services. Part 1 covers Object Names issues.

Object Names

One of the first issues you will come across when recording an Oracle Application is that Oracle objects are recorded by a number rather than a name. These numbers are dynamic and cannot be relied upon when playing back a script, i.e. the object cannot be found by LoadRunner as its “number” has changed.

Here is an example of objects recorded by their object number (this is part of a login script that was recorded using Oracle Applications 11i protocol against an Oracle Forms application):

nca_edit_set(“31”, ”USERNAME”);
nca_obj_type(“31”, ‘\t’, 0);
nca_edit_set(“32”, (”PASSWORD”));
nca_obj_type(“32”, ‘\t’, 0);
nca_edit_set(“33”, ”TRAINING”);
nca_button_press(“34”);

This script refers to four objects 31, 32, 33 and 34. If these objects do not change their number between recording and execution then the script should run OK. However these numbers are subject to change for example if a new field is added on the form between object 33 and object 34 then the nca_button_press(“34”) would fail as would now probably known as 35. To get round this issue Oracle offers the “RECORD=NAMES” method which associates a name to each object rather than a number. The name is very much more likely to remain static.

Here is the same example as above except the objects were recorded by their object name (this is part of a login script that was recorded using Oracle Applications 11i protocol against an Oracle Forms application):

nca_edit_set(“LOGON_INFO_USER_NAME”, ”USERNAME”);
nca_obj_type(“LOGON_INFO_USER_NAME”, ‘\t’, 0);
nca_edit_set(“LOGON_INFO_USER_PASSWORD”,(”PASSWORD”));
nca_obj_type(“LOGON_INFO_USER_PASSWORD”,(””, ‘\t’, 0);
nca_edit_set(“LOGON_INFO_USER_DATABASE”,(””,”TRAINING”);
nca_button_press(“LOGON_INFO_CONNECT_BUTTON”);

By default, in all the engagements that I have been involved in at least, Record=Names is not enabled. So how do you enable Record=Names? Here are four methods for achieving this, three of which require a configuration change and one which is very simple. I have found that finding the correct method is very much a “suck it and see” methodology.

Before trying the following just make sure that your installation records numbers instead of names by recording a simple logon script.

Method 1: Append to URL

This is very much the simplest method and should be tried first.

Below is the Start Recording dialog presented when recording using the Oracle Applications 11i protocol. The URL in this case is:

http://apps.acme.co.uk:7778/forms/frmservlet?config=2001

Figure 1

Try appending record=names to the end of the URL, for example:

http://apps.acme.co.uk:7778/forms/frmservlet?config=2001&record=names

Figure 2

Note if record=names is the first parameter to be added to the url then you will need a question mark before it eg:

http://apps.acme.co.uk:7778/forms/frmservlet?record=names

If however there are one or more parameters already in the url then you will need the ampersand prefix eg:

http://apps.acme.co.uk:7778/forms/frmservlet?config=2001&record=names

Now try and record a simple login script, if the object numbers are replaced by object names then you are in business. You should also notice that the record=names flag is appended to the connect_server statement.

Note: This method worked with the following configuration:

Oracle Forms version: 1012002
LR Protocol: Oracle Applications 11i
LR Version: 9.5
Jinitiator version: 1.3.1.28 (not overly important)

Method 2: Set record=names in startup file

This method requires a change to the HTML startup file on the forms server. Tracking which file to change can be a bit tricky if someone has renamed the appropriate file, which they are quite entitled to do. The file you are looking for is the one that is called when the forms applet starts. This file holds configuration details for the forms applet. By default the name of the file is basejini.htm.

The file contains a number of configuration entries.  The line you are interested in is something like this:

<PARAM name="serverArgs ... ... ... fndnam=APPS">

[param name="”serverArgs" fndnam="APPS”" /] Note there may be a number of entries which replace the ellipses (…) above.

Append record=names as the last argument i.e.: [param name="”serverArgs" fndnam="APPS" record="names”" /]

<PARAM name="serverArgs ... ... ... fndnam=APPS record=names">

Note: there is a space between the fndnam=APPS argument and record=names.

Now try and record a simple login script, if the object numbers are replaced by object names then you are in business. Note: This method worked with the following configuration:

Oracle Forms version: 60824
LR Protocol: Oracle Applications 11i
LR Version: 9.5
Jinitiator version: 1.1.8.16 (not overly important)

Method 3: Set value in formsweb file and HTML start-up file

I have had to use this method less often than the previous two methods. This method should be used if the HTML start-up file references the Forms CGI configuration file.  This method requires two files to be changed.

The Forms CGI configuration file in question is formsweb.cfg (it may have been renamed but probably not).

You will need to add a new entry in this file under the USER PARAMETERS in the section: “Values for Forms applet parameters”. Add the following as the last entry in this section:

xrecord=names

Your file should look something like this:

connectMode=socket
serverHost=serv1.acme.co.uk
xrecord=names

;4) Parameters fo Jinitiator

In the HTML start-up file basejini.htm (or whatever its name has been changed to) there are a number of configuration entries.  The lines you are interested in go something like this:

<PARAM name="serverArgs ... ... ... fndnam=APPS">

[param name="”serverArgs" fndnam="APPS”" /] Note there may be a number of entries which replace the ellipses (…) above.

Append record=%xrecord% as the last argument i.e.: [param name="”serverArgs" fndnam="APPS" record="%xrecord%”" /]

<PARAM name="serverArgs ... ... ... fndnam=APPS record=%xrecord%">

Note 1: there is a space between the fndnam=APPS argument and record=%xrecord%.
Note 2: there may be more than one entry in the HTML start-up file that needs to be changed

Method 4: Oracle Applications record=names flag

If you can access the Oracle Applications System administrator then you can change the profile of the users via the Profile System Values panel and appending ?play=&record=names to the ICX:Forms Launcher. At this time I have no screen shots for this process but please feel free to contact Testing Performance ( info@testingperformance.co.uk) should you need assistance and we will do our best to provide a more indepth procedure.
 

Part 2 coming soon!

Part 2 of this article covers Connect issues and other issues that you may encounter when doing performance testing with Oracle NCA– look out for it!
Remember if you need help with any Performance Testing Services please feel free to contact us.

Multi-Protocol (Oracle NCA/Web) Tips & Tricks

Tuning Garbage Collection Outline

This document is a summary or outline of Sun's document: Tuning Garbage collection with the 1.4.2 Hotspot JVM located here: http://java.sun.com/docs/hotspot/gc1.4.2/


1.0 Introduction
  • For many applications garbage collection performance is not significant
  • Default collector should be first choice
2.0 Generations
  • Most straightforward GC will just iterate over every object in the heap and determine if any other objects reference it.
    • This gets really slow as the number of objects in the heap increase
  • GC's therefor make assumptions about how your application runs.
  • Most common assumption is that an object is most likely to die shortly after it was created: called infant mortality
  • This assumes that an object that has been around for a while, will likely stay around for a while.
  • GC organizes objects into generations (young, tenured, and perm) This is important!
2.1 Performance Considerations
  • Ways to measure GC Performance
    • Throughput - % of time not spent in GC over a long period of time.
    • Pauses - app unresponsive because of GC
    • Footprint - overall memory a process takes to execute
    • Promptness - time between object death, and time when memory becomes available
  • There is no one right way to size generations, make the call based on your applications usage.
2.2 Measurement
  • Throughput and footprint are best measured using metrics particular to the application.
  • Command line argument -verbose:gc output
    [GC 325407K->83000K(776768K), 0.2300771 secs]
    • GC - Indicates that it was a minor collection (young generation). If it had said Full GC then that indicates that it was a major collection (tenured generation).
    • 325407K - The combined size of live objects before garbage collection.
    • 83000K - The combined size of live objects after garbage collection.
    • (776768K) - the total available space, not counting the space in the permanent generation, which is the total heap minus one of the survivor spaces.
    • 0.2300771 secs - time it took for garbage collection to occur.
  • You can get more detailed output using -XX:+PrintGCDetails and -XX:+PrintGCTimeStamps
3 Sizing the Generations
  • The -Xmx value determines the size of the heap to reserve at JVM initialization.
  • The -Xms value is the space in memory that is committed to the VM at init. The JVM can grow to the size of -Xmx.
  • The difference between -Xmx and -Xms is virtual memory (virtually committed)
3.1 Total Heap
  • Total available memory is the most important factor affecting GC performance
  • By default the JVM grows or shrinks the heap at each GC to keep the ratio of free space to live objects at each collection within a specified range.
    • -XX:MinHeapFreeRatio - when the percentage of free space in a generation falls below this value the generation will be expanded to meet this percentage. Default is 40
    • -XX:MaxHeapFreeRatio - when the percentage of free space in a generation exceeded this value the generation will shrink to meet this value. Default is 70
  • For server applications
    • Unless you have problems with pauses grant as much memory as possible to the JVM
    • Set -Xms and -Xmx close to each other or equal for a faster startup (removes constant resizing of JVM). But if you make a poor choice the JVM can't compensate for it.
    • Increase memory sa you increase # of processors because memory allocation can be parallelized.
3.2 The Young Generation
  • The bigger the young generation the less minor GC's, but this implies a smaller tenured generation which increases the frequency of major collections.
  • You need to look at your application and determine how long your objects live for to tune this.
  • -XX:NewRatio=3 - the young generation will occupy 1/4 the overall heap
  • -XX:NewSize - Size of the young generation at JVM init. Calculated automatically if you specify -XX:NewRatio
  • -XX:MaxNewSize - The largest size the young generation can grow to (unlimited if this value is not specified at command line)
3.2.1 Young Generation Guarantee
  • The -XX:SurvivorRatio option can be used to tune the number of survivor spaces.
  • Not often important for performance
    • -XX:SurvivorRatio=6 - each survivor space will be 1/8 the young generation
    • If survivor spaces are too small copying collection overflows directly into the tenured generation.
    • Survivor spaces too large uselessly empty
    • -XX:+PrintTenuringDistribution - shows the threshold chosen by JVM to keep survivors half full, and the ages of objects in the new generation.
  • Server Applications
    • First decide the total amount of memory you can afford to give the virtual machine. Then graph your own performance metric against young generation sizes to find the best setting.
    • Unless you find problems with excessive major collection or pause times, grant plenty of memory to the young generation.
    • Increasing the young generation becomes counterproductive at half the total heap or less (whenever the young generation guarantee cannot be met).
    • Be sure to increase the young generation as you increase the number of processors, since allocation can be parallelized.
4 Types of Collectors
  • Everything to this point talks about the default garbage collector, there are other GC's you can use
  • Throughput Collector - Uses a parallel version of the young generation collector
    • -XX:+UseParallelGC
    • Tenured collector is the same as in default
  • Concurrent Low Pause Collector
    • Collects tenured collection concurrently with the execution of the app.
    • The app is paused for short periods during collection
    • -XX:+UseConcMarkSweepGC
    • To enable a parallel young generation GC with the concurrent GC add -XX:+UseParNewGC to the startup. Don't add -XX:+UseParallelGC with this option.
  • Incremental Low Pause Collector
    • Sometimes called Train Collector
    • Collects a portion of the tenured generation at each minor collection.
    • Tries to minimize large pause of major collections
    • Slower than the default collector when considering overall throughput
    • Good for client apps (my observation)
    • -Xincgc
  • Don't mix these options, JVM may not behave as expected.
4.1 When to use Throughput Collector
  • Large number of processors
  • Reduces serial execution time of app, by using multiple threads for GC
  • App with lots of threads allocating objects should use this with a large young generation
  • Server Applications (my observation)
4.2 The Throughput collector
  • By default the throughput collector uses the number of CPU's as its value for number of GC threads.
  • On a computer with one CPU it will not perform as well as the default collector
  • Overhead from parallel execution (synchronization costs)
  • With 2 CPU's the throughput collector performs as well as the default garbage collector.
  • With more then 2 CPU's you can expect to see a reduction in minor GC pause times
  • You can control the number of threads with -XX:ParallelGCThreads=n
  • Fragmentation can occur
    • Reduce GC threads
    • Increase Tenured Generation size
4.2.1 Adaptive Sizing
  • Keeps stats about GC times, allocation rates, and free space then sizes young and tenured generation to best fit the app.
  • J2SE 1.4.1 and later
  • -XX:+UseAdaptiveSizePolicy (on by default)
4.2.2 Aggressive Heap
  • Attempts to make maximum use of physical memory for the heap
  • Inspects computer resources (memory, num processors) and sets params optimal for long running memory allocation intensive jobs.
  • Must have at least 256MB of RAM
  • For lots of CPU's and RAM, but 1.4.1+ has shown improvements on 4-Way machines.
  • -XX:+AggressiveHeap
4.3 When to use the Concurrent Low Pause Collector
  • Apps that benefit from shorter GC pauses, and can share resources with GC during execution.
  • Apps with large sets of long living data (tenured generation)
  • Two or more processors
  • Interactive apps with modest tenured generation size, and one CPU
4.4 The Concurrent Low Pause Collector
  • Uses a separate GC thread to do parts of the major collection concurrently with the app threads.
  • Pauses App threads in the beginning of a collection and toward the middle (longer pause in middle)
  • The rest of the GC is in a single thread that runs at the same time as the app
4.4.1 Overhead of Concurrency
  • Doesn't provide much of an advantage on single processor machines.
  • Fragmentation can occur.
  • Two processor machine eliminates pauses due to the GC thread.
  • The more CPU's the advantages of concurrent collector increase.
4.4.2 Young Generation Guarantee
  • There has to be enough contiguous space available in the tenured generation for all objects in the eden and one survivor space.
  • A larger heap is needed compared to the default collector.
  • Add the size of the young generation to the tenured generation.
4.4.3 Full Collections
  • If the concurrent collector is unable to finish collecting the tenured generation before the tenured generation fills up, the application is paused and the collection is completed.
  • When this happens you should make some adjustments to your GC params
4.4.4 Floating Garbage
  • Floating Garbage - Objects that die while the GC is running (after they have been checked).
  • Increase the tenured generation by 20% to reduce floating garbage.
4.4.5 Pauses
  • First Pause - marks live objects - initial marking
  • Second Pause - remarking phase - checks objects that were missed during the concurrent marking phase due to the concurrent execution of the app threads.
4.4.6 Concurrent Phases
  • Concurrent Marking phase occurs between initial mark and remarking phase.
  • Concurrent sweeping phase collects dead objects after the remarking phase.
4.4.7 Measurements with the Concurrent Collector
  • Use -verbose:gc with -XX:+PrintGCDetails
  • vCMS-initial-mark shows GC stats for the initial marking phase
  • CMS-concurrent-mark - shows GC stats for concurrent marking phase.
  • CMS-concurrent-sweep - shows stats for concurrent sweeping phase
  • CMS-concurrent-preclean - stats for determining work that can be done concurrently
  • CMS-remark - stats for the remarking phase.
  • CMS-concurrent-reset - concurrent stuff is done, ready for next collection.
4.4.8 Parallel Minor Collection Options with Concurrent Collector
  • -XX:+UseParNewGC - for multiprocessor machines, enables multi threaded young generation collection.
  • -XX:+CMSParallelRemarkEnabled - reduce remark pauses
4.5 When to use the Incremental Low Pause Collector
  • Use when you can afford to tradeoff longer and more frequent young generation GC pauses for shorter tenured generation pauses
  • You have a large tenured generation
  • Single Processor
4.6 The Incremental Low Pause Collector
  • Minor collections same as default collector.
  • Don't use try to use parallel GC with this collector
  • Incrementally Collects parts of the tenured generation at each young collection.
  • Tries to avoid long major collections by doing small chunks each minor collection.
  • Can cause fragmentation of the heap. Sometimes need to increase tenured generation size compared to the default.
  • There is some overhead required to maintain the position of the incremental collector. Less overhead than is required by the default collector.
  • First try the default collector, and adjust heap sizing. If major pauses are too long try incremental.
  • If the incremental collector can't collect the tenured generation fast enough you will run out of memory, try reducing the young generation.
  • If young generation collections do not free any space, could be because of fragmentation. Increase tenured generation size.
4.6.1 Measurements with the Incremental Collector
  • -verbose:gc and -XX:+PrintGCDetails
  • Look for the Train: to see the stats for the incremental collection.
5 Other Considerations
  • The permanent generation may be a factor on apps that dynamically generate and load many classes (JSP, CFM application servers)
  • You may need to increase the MaxPermSize, eg: -XX:MaxPermSize=128m
  • Apps that rely on finalization (finalize method, or finally clauses) will cause lag in garbage collection. This is a bad idea, use only for errorious situations.
  • Explicit garbage collection calls (System.gc()) force a major collection. You can measure the effectiveness of these calls by disabling them with -XX:+DisableExplicitGC
  • RMI garbage collection intervals can be controlled with
    • -Dsun.rmi.dgc.client.gcInteraval=3600000
    • -Dsun.rmi.dgc.server.gcInterval=3600000
  • On Solaris 8+ you can enable libthreads, lightweight thread processes, these may increase thread performance.
  • To enable add /usr/lib/lwp to LD_LIBRARY_PATH
  • Soft References cleared less aggressively in server.
  • -XX:SoftRefLRUPolicyMSPerMB=10000
  • Default value is 1000, or one second per MB
6 Conclusion
  • GC can be bottleneck in your app.
More Information

The impact of Garbage Collection on Application Performance

As we've seen, the performance of the garbage collector is not determined by the number of dead objects, but rather by the number of live ones. The more objects die, the faster garbage collection is. If every object in the heap were to be garbage-collected, the GC cycle would be nearly instantaneous. Additionally, the garbage collector must suspend the execution of the application to ensure the integrity of the object trees. The more live objects are found, the longer the suspension, which has a direct impact on response time and throughput.

This fundamental tenet of garbage collection and the resulting effect on application execution is called the garbage-collection pause or GC pause time. In applications with multiple threads, this can quickly lead to scalability problems.
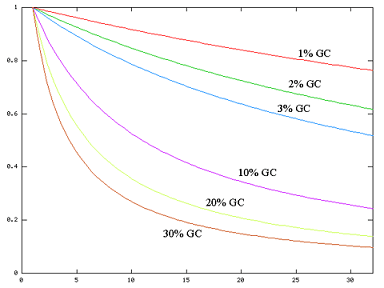
This graphic from the Oracle GC Tuning article illustrates the performance hit of GC suspensions with increasing number of CPUs.
Figure 2.4: This graphic from an Oracle GC Tuning article illustrates the performance hit of GC suspensions with increasing number of CPUs. (Source: http://www.oracle.com/technetwork/java/javase/gc-tuning-6-140523.html)
Figure 2.4 illustrates the impact that GC suspensions have on the throughput of multithreaded applications. An application that spends 1% of its execution time on garbage collection will loose more than 20% throughput on a 32-processor system. If we increase the GC time to 2%, the overall throughput will drop by another 20%. Such is the impact of suspending 32 executing threads simultaneously!
There are two commonly used methods to reduce GC pause time:
  • Reducing suspension time by adjusting the mark-and-sweep algorithm.
  • Limiting the number of objects that need to be marked.
But before we examine ways to improve garbage-collection performance, you should understand memory fragmentation, which impacts suspension time and application performance.

About Fragmented Memory and Finding a Big Enough Hole

Whenever we create a new object in Java, the JVM automatically allocates a block of memory large enough to fit the new object on the heap. Repeated allocation and reclamation leads to memory fragmentation, which is similar to disk fragmentation. Memory fragmentation leads to two problems:
  • Reduced allocation speed: The JVM tracks free memory in lists organized by block size. To create a new object, Java searches through the lists to select and allocate an optimally sized block. Fragmentation slows the allocation process, effectively slowing the application execution.
  • Allocation Errors: Allocation errors happen when fragmentation becomes so great that the JVM is unable to allocate a sufficiently large block of memory for a new object.
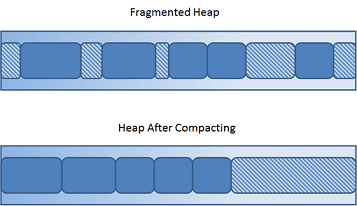
Java does not rely on the operating system to solve these problems and must deal with these itself. Java avoids memory fragmentation by executing compaction (Figure 2.5) at the end of a successful GC cycle. The process is very similar to hard-disk defragmentation.
When the heap becomes fragmented due to repeated allocations and garbage collections, the JVM executes a compaction step, which alligns all objects neatly and closes all holes.
Figure 2.5: When the heap becomes fragmented due to repeated allocations and garbage collections, the JVM executes a compaction step, which aligns all objects neatly and closes all holes.
Compacting simply moves all live objects to one end of the heap, which effectively closes all holes. Objects can be allocated at full speed (no free lists are needed anymore), and problems creating large objects are avoided.
The downside is an even longer GC cycle, and since most JVMs suspend the application execution during compaction, the performance impact can be considerable.
ENABLE OPROFILE


Add the following to the JVM's start parameters, usually standalone.conf or domain.confin the platform's JBOSS_EAP_DIST/bin directory.
# 64-bit JVM
-agentpath:/usr/lib64/oprofile/libjvmti_oprofile.so
# 32-bit JVM
-agentpath:/usr/lib/oprofile/libjvmti_oprofile.so
For example:
# Specify options to pass to the Java VM.
#
if [ "x$JAVA_OPTS" = "x" ]; then
   JAVA_OPTS="-Xms10240m -Xmx10240m -XX:+UseLargePages -XX:+UseParallelOldGC"
   JAVA_OPTS="$JAVA_OPTS -Djava.net.preferIPv4Stack=true -Dorg.jboss.resolver.warning=true"
   JAVA_OPTS="$JAVA_OPTS -Dsun.rmi.dgc.client.gcInterval=3600000 -Dsun.rmi.dgc.server.gcInterval=3600000"
   JAVA_OPTS="$JAVA_OPTS -agentpath:/usr/lib64/oprofile/libjvmti_oprofile.so"
fi

GARBAGE COLLECTION AND PERFORMANCE TUNING

For all the tests referred to in this book the JVM garbage collection option used was: -XX:+UseParallelOldGC. Many people choose the Concurrent Mark and Sweep (CMS) collector, collection is slower on both the Eden space and Old generation. The following graph shows the difference between using the throughput collector with parallel collection on the Old generation in comparison to using the CMS collector, which works on the Old generation and parallel collection on the Eden space.
Transactional OLTP Workload
Figure 9.5. Transactional OLTP Workload
The difference in performance between the Parallel Garbage Collector and the Concurrent Mark and Sweep Garbage collector can be explained by their underlying design. If you do not specify the option -XX:+UseParallelOldGC, the throughput collector defaults to parallel collection on the Eden space, and single threaded collection on the Old generation. With a 12GB heap, the Old generation is 8GB in size, which is a lot of memory to garbage collect in a single thread fashion. By specifying that the Old generation should also be collected in parallel, the collection algorithms designed for the highest throughput is used, hence the name "throughput collector". When the option -XX:+UseParallelOldGC is specified it also enables the option -XX:+UseParNewGC. In comparison, the CMS collector is not optimized for throughput but instead for more predictable response times. The focus of this book is tuning for throughput, not response time. The choice of garbage collector depends on whether higher throughput or more predictable response times benefits the application most. For real-time systems, the trade-off is usually lower throughput for more deterministic results in response times.
OTHER JVM OPTIONS TO CONSIDER
This section covers some additional JVM options:
  • -XX:+CompressedOops
  • -XX:+AggressiveOpts
  • -XX:+DoEscapeAnalysis
  • -XX:+UseBiasedLocking
  • -XX:+EliminateLocks
Warning
When considering the JVM options covered in this section, be aware that their behavior is subject to change depending on the version, therefore the effect of each should be tested before being implemented in a production environment.
Compressed OOPs, covered briefly in Section 9.1, “32-bit vs. 64-bit JVM”, implements a compression of the internal memory pointers within the JVM for objects and so reduces the heap. From JVM revision 1.6.0_20 and above compressed OOPs is on by default but if an earlier revision of the JDK is being used this option should be used for heap sizes 32GB and lower.
Aggressive optimizations, -XX:+AggressiveOpts, enables additional Hotspot JVM optimizations that are not enabled by default. The behavior enabled by this option is subject to change with each JVM release and so its effects should be tested prior to implementing it in production.
The final options are locking based options, -XX:+DoEscapeAnalysis, -XX:+UseBiasedLocking and -XX:+EliminateLocks. They are designed to work together to eliminate locking overhead. Their effect on performance is unpredictable for specific workloads and so require testing prior to being implemented. Reduced locking should improve concurrency and, on current multi-core hardware, improve throughput.
In summary, all these options should be considered on their merits. To accurately judge their impact on performance they should be tested independently of each other

PROFILING

Profiling is monitoring the resource usage of an application with the aim of detecting areas for improvement. One of the difficulties in profiling is choosing a tool which provides useful data without having too great an impact on performance itself. On Red Hat Enterprise Linux, the OProfile tool is available for profiling the JBoss Enterprise Application Platform, requiring less system resources that other profiling tools.

10.1. Install

Task: Install OProfile
Complete this task to install OProfile and its dependencies.
  1. In a terminal, enter the following command:
    yum install oprofile oprofile-jit
    
  2. For all enabled yum repositories (/etc/yum.repos.d/*.repo), replace enabled=0 with enabled=1 in each file's debuginfo section. If there is no debug section, add it, using the example below as a template.
    [rhel-debuginfo]
    name=Red Hat Enterprise Linux $releasever - $basearch - Debug
    baseurl=ftp://ftp.redhat.com/pub/redhat/linux/enterprise/$releasever/en/os/$basearch/Debuginfo/
    enabled=1
    gpgcheck=1
    gpgkey=file:///etc/pki/rpm-gpg/RPM-GPG-KEY-redhat-release
    
  3. In a terminal, enter the following command, modifying the JDK version number to match the version installed:
    yum install yum-plugin-auto-update-debug-info java-1.6.0-openjdk-debuginfo